Graphics are placed on the current drawing according to the current transformation matrix. You can either modify this indirectly, using functions, or set the matrix directly.
Transformation functions
For basic transformations, use translate(tx, ty), scale(sx, sy), and rotate(a).
Translation
translate(pos) (and translate(x, y)) shift the current origin to pos or by the specified amounts in x and y. It's relative and cumulative, rather than absolute:
for i in range(0, step=30, length=6)
    sethue(HSV(i, 1, 1)) # from Colors
    setopacity(0.5)
    circle(Point(0, 0), 40, :fillpreserve)
    setcolor("black")
    strokepath()
    translate(50, 0)
end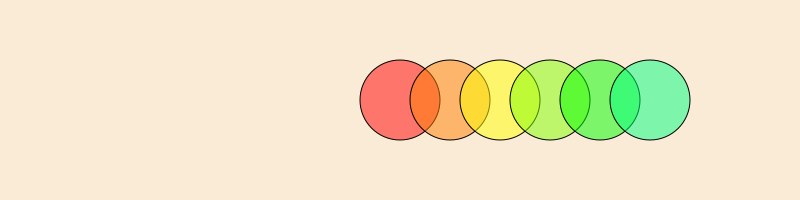
Scaling
scale(x, y) and scale(n) scale the current workspace by the specified amounts. It's relative to the current scale, not to the drawing's original.
origin()
for i in range(0, step=30, length=6)
    sethue(HSV(i, 1, 1)) # from Colors
    circle(Point(0, 0), 130, :fillpreserve)
    setcolor("black")
    strokepath()
    scale(0.8)
end
Rotation
rotate rotates the current workspace by the specified amount about the current 0/0 point. It's relative to the previous rotation - "rotate by".
origin()
for i in 1:8
    randomhue()
    squircle(Point(40, 0), 20, 30, :fillpreserve)
    sethue("black")
    strokepath()
    rotate(π/4)
end
origin resets the matrix then moves the origin to the center of the page.
Use the getscale, gettranslation, and getrotation functions to find the current values.
To quickly return home after many changes, you can use setmatrix([1, 0, 0, 1, 0, 0]) to reset the matrix to the default.
Linear interpolation ("lerp")
rescale is a convenient utility function for linear interpolation. An easy way to visualize it is by imagining two number lines. A value relative to a pair of low and high values is rescaled to have the equivalent value relative to another pair of low and high values.
;fill-opacity:1;stroke:none;"/>
<path style=" stroke:none;fill-rule:nonzero;fill:rgb(100%25,0%25,0%25);fill-opacity:1;" d="M 408 140 C 408 144.417969 404.417969 148 400 148 C 395.582031 148 392 144.417969 392 140 C 392 135.582031 395.582031 132 400 132 C 404.417969 132 408 135.582031 408 140 Z M 408 140 "/>
<g style="fill:rgb(0%25,0%25,0%25);fill-opacity:1;">
<use xlink:href="%23glyph-5442310-1" x="380.358" y="40"/>
<use xlink:href="%23glyph-5442310-2" x="388.184" y="40"/>
<use xlink:href="%23glyph-5442310-3" x="391.733" y="40"/>
<use xlink:href="%23glyph-5442310-2" x="399.853" y="40"/>
<use xlink:href="%23glyph-5442310-4" x="403.402" y="40"/>
<use xlink:href="%23glyph-5442310-5" x="411.522" y="40"/>
</g>
<g style="fill:rgb(0%25,0%25,0%25);fill-opacity:1;">
<use xlink:href="%23glyph-5442310-6" x="315.6045" y="80"/>
<use xlink:href="%23glyph-5442310-7" x="320.7215" y="80"/>
<use xlink:href="%23glyph-5442310-8" x="328.1275" y="80"/>
<use xlink:href="%23glyph-5442310-9" x="334.2035" y="80"/>
<use xlink:href="%23glyph-5442310-10" x="340.8955" y="80"/>
<use xlink:href="%23glyph-5442310-11" x="347.8815" y="80"/>
<use xlink:href="%23glyph-5442310-7" x="351.2135" y="80"/>
<use xlink:href="%23glyph-5442310-12" x="358.6195" y="80"/>
<use xlink:href="%23glyph-5442310-1" x="362.3715" y="80"/>
<use xlink:href="%23glyph-5442310-13" x="370.1975" y="80"/>
<use xlink:href="%23glyph-5442310-2" x="373.3895" y="80"/>
<use xlink:href="%23glyph-5442310-4" x="376.9385" y="80"/>
<use xlink:href="%23glyph-5442310-14" x="385.0585" y="80"/>
<use xlink:href="%23glyph-5442310-13" x="393.1785" y="80"/>
<use xlink:href="%23glyph-5442310-2" x="396.3705" y="80"/>
<use xlink:href="%23glyph-5442310-15" x="399.9195" y="80"/>
<use xlink:href="%23glyph-5442310-14" x="408.0395" y="80"/>
<use xlink:href="%23glyph-5442310-13" x="416.1595" y="80"/>
<use xlink:href="%23glyph-5442310-2" x="419.3515" y="80"/>
<use xlink:href="%23glyph-5442310-16" x="422.9005" y="80"/>
<use xlink:href="%23glyph-5442310-13" x="431.0205" y="80"/>
<use xlink:href="%23glyph-5442310-2" x="434.2125" y="80"/>
<use xlink:href="%23glyph-5442310-17" x="437.7615" y="80"/>
<use xlink:href="%23glyph-5442310-18" x="445.8815" y="80"/>
<use xlink:href="%23glyph-5442310-2" x="449.6335" y="80"/>
<use xlink:href="%23glyph-5442310-3" x="453.1825" y="80"/>
<use xlink:href="%23glyph-5442310-2" x="461.3025" y="80"/>
<use xlink:href="%23glyph-5442310-16" x="464.8515" y="80"/>
<use xlink:href="%23glyph-5442310-19" x="472.9715" y="80"/>
<use xlink:href="%23glyph-5442310-5" x="476.2755" y="80"/>
</g>
<path style="fill:none;stroke-width:1;stroke-linecap:butt;stroke-linejoin:miter;stroke:rgb(0%25,0%25,0%25);stroke-opacity:1;stroke-miterlimit:10;" d="M 200 140 L 600 140 "/>
<path style="fill:none;stroke-width:1;stroke-linecap:butt;stroke-linejoin:miter;stroke:rgb(0%25,0%25,0%25);stroke-opacity:1;stroke-miterlimit:10;" d="M 200 140 L 200 168 "/>
<g style="fill:rgb(0%25,0%25,0%25);fill-opacity:1;">
<use xlink:href="%23glyph-5442310-16" x="190.228" y="186.557"/>
<use xlink:href="%23glyph-5442310-19" x="198.348" y="186.557"/>
<use xlink:href="%23glyph-5442310-14" x="201.652" y="186.557"/>
</g>
<path style="fill:none;stroke-width:1;stroke-linecap:butt;stroke-linejoin:miter;stroke:rgb(0%25,0%25,0%25);stroke-opacity:1;stroke-miterlimit:10;" d="M 240 140 L 240 168 "/>
<g style="fill:rgb(0%25,0%25,0%25);fill-opacity:1;">
<use xlink:href="%23glyph-5442310-16" x="230.228" y="186.466"/>
<use xlink:href="%23glyph-5442310-19" x="238.348" y="186.466"/>
<use xlink:href="%23glyph-5442310-16" x="241.652" y="186.466"/>
</g>
<path style="fill:none;stroke-width:1;stroke-linecap:butt;stroke-linejoin:miter;stroke:rgb(0%25,0%25,0%25);stroke-opacity:1;stroke-miterlimit:10;" d="M 280 140 L 280 168 "/>
<g style="fill:rgb(0%25,0%25,0%25);fill-opacity:1;">
<use xlink:href="%23glyph-5442310-16" x="270.228" y="186.557"/>
<use xlink:href="%23glyph-5442310-19" x="278.348" y="186.557"/>
<use xlink:href="%23glyph-5442310-17" x="281.652" y="186.557"/>
</g>
<path style="fill:none;stroke-width:1;stroke-linecap:butt;stroke-linejoin:miter;stroke:rgb(0%25,0%25,0%25);stroke-opacity:1;stroke-miterlimit:10;" d="M 320 140 L 320 168 "/>
<g style="fill:rgb(0%25,0%25,0%25);fill-opacity:1;">
<use xlink:href="%23glyph-5442310-16" x="310.228" y="186.557"/>
<use xlink:href="%23glyph-5442310-19" x="318.348" y="186.557"/>
<use xlink:href="%23glyph-5442310-4" x="321.652" y="186.557"/>
</g>
<path style="fill:none;stroke-width:1;stroke-linecap:butt;stroke-linejoin:miter;stroke:rgb(0%25,0%25,0%25);stroke-opacity:1;stroke-miterlimit:10;" d="M 360 140 L 360 168 "/>
<g style="fill:rgb(0%25,0%25,0%25);fill-opacity:1;">
<use xlink:href="%23glyph-5442310-16" x="350.228" y="186.466"/>
<use xlink:href="%23glyph-5442310-19" x="358.348" y="186.466"/>
<use xlink:href="%23glyph-5442310-15" x="361.652" y="186.466"/>
</g>
<path style="fill:none;stroke-width:1;stroke-linecap:butt;stroke-linejoin:miter;stroke:rgb(0%25,0%25,0%25);stroke-opacity:1;stroke-miterlimit:10;" d="M 400 140 L 400 168 "/>
<g style="fill:rgb(0%25,0%25,0%25);fill-opacity:1;">
<use xlink:href="%23glyph-5442310-16" x="390.228" y="186.466"/>
<use xlink:href="%23glyph-5442310-19" x="398.348" y="186.466"/>
<use xlink:href="%23glyph-5442310-5" x="401.652" y="186.466"/>
</g>
<path style="fill:none;stroke-width:1;stroke-linecap:butt;stroke-linejoin:miter;stroke:rgb(0%25,0%25,0%25);stroke-opacity:1;stroke-miterlimit:10;" d="M 440 140 L 440 168 "/>
<g style="fill:rgb(0%25,0%25,0%25);fill-opacity:1;">
<use xlink:href="%23glyph-5442310-16" x="430.228" y="186.466"/>
<use xlink:href="%23glyph-5442310-19" x="438.348" y="186.466"/>
<use xlink:href="%23glyph-5442310-20" x="441.652" y="186.466"/>
</g>
<path style="fill:none;stroke-width:1;stroke-linecap:butt;stroke-linejoin:miter;stroke:rgb(0%25,0%25,0%25);stroke-opacity:1;stroke-miterlimit:10;" d="M 480 140 L 480 168 "/>
<g style="fill:rgb(0%25,0%25,0%25);fill-opacity:1;">
<use xlink:href="%23glyph-5442310-16" x="470.228" y="186.466"/>
<use xlink:href="%23glyph-5442310-19" x="478.348" y="186.466"/>
<use xlink:href="%23glyph-5442310-21" x="481.652" y="186.466"/>
</g>
<path style="fill:none;stroke-width:1;stroke-linecap:butt;stroke-linejoin:miter;stroke:rgb(0%25,0%25,0%25);stroke-opacity:1;stroke-miterlimit:10;" d="M 520 140 L 520 168 "/>
<g style="fill:rgb(0%25,0%25,0%25);fill-opacity:1;">
<use xlink:href="%23glyph-5442310-16" x="510.228" y="186.557"/>
<use xlink:href="%23glyph-5442310-19" x="518.348" y="186.557"/>
<use xlink:href="%23glyph-5442310-22" x="521.652" y="186.557"/>
</g>
<path style="fill:none;stroke-width:1;stroke-linecap:butt;stroke-linejoin:miter;stroke:rgb(0%25,0%25,0%25);stroke-opacity:1;stroke-miterlimit:10;" d="M 560 140 L 560 168 "/>
<g style="fill:rgb(0%25,0%25,0%25);fill-opacity:1;">
<use xlink:href="%23glyph-5442310-16" x="550.228" y="186.557"/>
<use xlink:href="%23glyph-5442310-19" x="558.348" y="186.557"/>
<use xlink:href="%23glyph-5442310-23" x="561.652" y="186.557"/>
</g>
<path style="fill:none;stroke-width:1;stroke-linecap:butt;stroke-linejoin:miter;stroke:rgb(0%25,0%25,0%25);stroke-opacity:1;stroke-miterlimit:10;" d="M 600 140 L 600 168 "/>
<g style="fill:rgb(0%25,0%25,0%25);fill-opacity:1;">
<use xlink:href="%23glyph-5442310-17" x="590.228" y="186.557"/>
<use xlink:href="%23glyph-5442310-19" x="598.348" y="186.557"/>
<use xlink:href="%23glyph-5442310-14" x="601.652" y="186.557"/>
</g>
<path style="fill:none;stroke-width:1;stroke-linecap:butt;stroke-linejoin:miter;stroke:rgb(0%25,0%25,0%25);stroke-opacity:1;stroke-miterlimit:10;" d="M 200 140 L 600 140 "/>
<path style="fill:none;stroke-width:1;stroke-linecap:butt;stroke-linejoin:miter;stroke:rgb(0%25,0%25,0%25);stroke-opacity:1;stroke-miterlimit:10;" d="M 200 140 L 200 135 "/>
<g style="fill:rgb(0%25,0%25,0%25);fill-opacity:1;">
<use xlink:href="%23glyph-5442310-4" x="186.168" y="126.8785"/>
<use xlink:href="%23glyph-5442310-14" x="194.288" y="126.8785"/>
<use xlink:href="%23glyph-5442310-19" x="202.408" y="126.8785"/>
<use xlink:href="%23glyph-5442310-14" x="205.712" y="126.8785"/>
</g>
<path style="fill:none;stroke-width:1;stroke-linecap:butt;stroke-linejoin:miter;stroke:rgb(0%25,0%25,0%25);stroke-opacity:1;stroke-miterlimit:10;" d="M 240 140 L 240 135 "/>
<g style="fill:rgb(0%25,0%25,0%25);fill-opacity:1;">
<use xlink:href="%23glyph-5442310-4" x="226.168" y="126.8785"/>
<use xlink:href="%23glyph-5442310-16" x="234.288" y="126.8785"/>
<use xlink:href="%23glyph-5442310-19" x="242.408" y="126.8785"/>
<use xlink:href="%23glyph-5442310-14" x="245.712" y="126.8785"/>
</g>
<path style="fill:none;stroke-width:1;stroke-linecap:butt;stroke-linejoin:miter;stroke:rgb(0%25,0%25,0%25);stroke-opacity:1;stroke-miterlimit:10;" d="M 280 140 L 280 135 "/>
<g style="fill:rgb(0%25,0%25,0%25);fill-opacity:1;">
<use xlink:href="%23glyph-5442310-4" x="266.168" y="126.8785"/>
<use xlink:href="%23glyph-5442310-17" x="274.288" y="126.8785"/>
<use xlink:href="%23glyph-5442310-19" x="282.408" y="126.8785"/>
<use xlink:href="%23glyph-5442310-14" x="285.712" y="126.8785"/>
</g>
<path style="fill:none;stroke-width:1;stroke-linecap:butt;stroke-linejoin:miter;stroke:rgb(0%25,0%25,0%25);stroke-opacity:1;stroke-miterlimit:10;" d="M 320 140 L 320 135 "/>
<g style="fill:rgb(0%25,0%25,0%25);fill-opacity:1;">
<use xlink:href="%23glyph-5442310-4" x="306.168" y="126.8785"/>
<use xlink:href="%23glyph-5442310-4" x="314.288" y="126.8785"/>
<use xlink:href="%23glyph-5442310-19" x="322.408" y="126.8785"/>
<use xlink:href="%23glyph-5442310-14" x="325.712" y="126.8785"/>
</g>
<path style="fill:none;stroke-width:1;stroke-linecap:butt;stroke-linejoin:miter;stroke:rgb(0%25,0%25,0%25);stroke-opacity:1;stroke-miterlimit:10;" d="M 360 140 L 360 135 "/>
<g style="fill:rgb(0%25,0%25,0%25);fill-opacity:1;">
<use xlink:href="%23glyph-5442310-4" x="346.168" y="126.8785"/>
<use xlink:href="%23glyph-5442310-15" x="354.288" y="126.8785"/>
<use xlink:href="%23glyph-5442310-19" x="362.408" y="126.8785"/>
<use xlink:href="%23glyph-5442310-14" x="365.712" y="126.8785"/>
</g>
<path style="fill:none;stroke-width:1;stroke-linecap:butt;stroke-linejoin:miter;stroke:rgb(0%25,0%25,0%25);stroke-opacity:1;stroke-miterlimit:10;" d="M 400 140 L 400 135 "/>
<g style="fill:rgb(0%25,0%25,0%25);fill-opacity:1;">
<use xlink:href="%23glyph-5442310-4" x="386.168" y="126.8785"/>
<use xlink:href="%23glyph-5442310-5" x="394.288" y="126.8785"/>
<use xlink:href="%23glyph-5442310-19" x="402.408" y="126.8785"/>
<use xlink:href="%23glyph-5442310-14" x="405.712" y="126.8785"/>
</g>
<path style="fill:none;stroke-width:1;stroke-linecap:butt;stroke-linejoin:miter;stroke:rgb(0%25,0%25,0%25);stroke-opacity:1;stroke-miterlimit:10;" d="M 440 140 L 440 135 "/>
<g style="fill:rgb(0%25,0%25,0%25);fill-opacity:1;">
<use xlink:href="%23glyph-5442310-4" x="426.168" y="126.8785"/>
<use xlink:href="%23glyph-5442310-20" x="434.288" y="126.8785"/>
<use xlink:href="%23glyph-5442310-19" x="442.408" y="126.8785"/>
<use xlink:href="%23glyph-5442310-14" x="445.712" y="126.8785"/>
</g>
<path style="fill:none;stroke-width:1;stroke-linecap:butt;stroke-linejoin:miter;stroke:rgb(0%25,0%25,0%25);stroke-opacity:1;stroke-miterlimit:10;" d="M 480 140 L 480 135 "/>
<g style="fill:rgb(0%25,0%25,0%25);fill-opacity:1;">
<use xlink:href="%23glyph-5442310-4" x="466.168" y="126.8785"/>
<use xlink:href="%23glyph-5442310-21" x="474.288" y="126.8785"/>
<use xlink:href="%23glyph-5442310-19" x="482.408" y="126.8785"/>
<use xlink:href="%23glyph-5442310-14" x="485.712" y="126.8785"/>
</g>
<path style="fill:none;stroke-width:1;stroke-linecap:butt;stroke-linejoin:miter;stroke:rgb(0%25,0%25,0%25);stroke-opacity:1;stroke-miterlimit:10;" d="M 520 140 L 520 135 "/>
<g style="fill:rgb(0%25,0%25,0%25);fill-opacity:1;">
<use xlink:href="%23glyph-5442310-4" x="506.168" y="126.8785"/>
<use xlink:href="%23glyph-5442310-22" x="514.288" y="126.8785"/>
<use xlink:href="%23glyph-5442310-19" x="522.408" y="126.8785"/>
<use xlink:href="%23glyph-5442310-14" x="525.712" y="126.8785"/>
</g>
<path style="fill:none;stroke-width:1;stroke-linecap:butt;stroke-linejoin:miter;stroke:rgb(0%25,0%25,0%25);stroke-opacity:1;stroke-miterlimit:10;" d="M 560 140 L 560 135 "/>
<g style="fill:rgb(0%25,0%25,0%25);fill-opacity:1;">
<use xlink:href="%23glyph-5442310-4" x="546.168" y="126.8785"/>
<use xlink:href="%23glyph-5442310-23" x="554.288" y="126.8785"/>
<use xlink:href="%23glyph-5442310-19" x="562.408" y="126.8785"/>
<use xlink:href="%23glyph-5442310-14" x="565.712" y="126.8785"/>
</g>
<path style="fill:none;stroke-width:1;stroke-linecap:butt;stroke-linejoin:miter;stroke:rgb(0%25,0%25,0%25);stroke-opacity:1;stroke-miterlimit:10;" d="M 600 140 L 600 135 "/>
<g style="fill:rgb(0%25,0%25,0%25);fill-opacity:1;">
<use xlink:href="%23glyph-5442310-15" x="586.168" y="126.8785"/>
<use xlink:href="%23glyph-5442310-14" x="594.288" y="126.8785"/>
<use xlink:href="%23glyph-5442310-19" x="602.408" y="126.8785"/>
<use xlink:href="%23glyph-5442310-14" x="605.712" y="126.8785"/>
</g>
</g>
</svg>)
This function is sometimes called “lerp” in other systems. For example, in Processing, the lerp() function takes the form lerp(low, high, value), where the returned value lies between low and high corresponding to how value lies between 0 and 1.
The equivalent to lerp(10, 20, 0.5) in Luxor is rescale(0.5, 0, 1, 10, 20). Luxor requires a ‘from’ scale (here ... 0, 1, ...) although the ‘to’ scale is optional and defaults to 0, 1.
Scaling of line thickness
Line thicknesses are not scaled by default. For example, with a current line thickness set by setline(1), lines drawn before and after scale(2) will be the same thickness. If you want line thicknesses to respond to the current scale, so that a line thickness of 1 is scaled by n after calls to scale(n), you can call setstrokescale with true to enable stroke scaling, and setstrokescale(false) to disable it. You can also enable stroke scaling when creating a new Drawing by passing the named argument strokescale during Drawing construction (i.e., Drawing(400, 400, strokescale=true)).
Matrices
In Luxor, there's always a current matrix that determines how coordinates are interpreted in the current workspace. In Cairo, it's a six element array:
\[\begin{bmatrix} 1 & 0 & 0 \\ 0 & 1 & 0 \\ \end{bmatrix}\]
and Luxor/Cairo matrix functions accept and return simple 6-element vectors:
julia> getmatrix()
6-element Array{Float64,1}:
   1.0
   0.0
   0.0
   1.0
   0.0
0.0You can convert between the 6-element and 3x3 versions of a transformation matrix using the functions cairotojuliamatrix and juliatocairomatrix.
transform(a) transforms the current workspace by ‘multiplying’ the current matrix with matrix a. For example, transform([1, 0, xskew, 1, 50, 0]) skews the current matrix by xskew radians and moves it 50 in x and 0 in y.
function boxtext(p, t)
    sethue("grey30")
    box(p, 30, 50, :fill)
    sethue("white")
    textcentered(t, p)
end

for i in 0:5
    xskew = tand(i * 5.0)
    transform([1, 0, xskew, 1, 50, 0])
    boxtext(O, string(round(rad2deg(xskew), digits=1), "°"))
end
getmatrix gets the current matrix, setmatrix(a) sets the matrix to array a.
Other functions include getmatrix, setmatrix, transform, crossproduct, blendmatrix, rotationmatrix, scalingmatrix, and translationmatrix.
Use the getscale, gettranslation, and getrotation functions to find the current values of the current matrix. These can also find the values of arbitrary 3x3 matrices.
World position
If you use translate to move the origin to different places on a drawing, you can use getworldposition to find the "true" world coordinates of points. In the following example, we temporarily translate to a random point, and "drop a pin" that remembers the new origin in terms of the drawing's world coordinates. After the temporary translation is over, we have a record of where it was.
origin()

@layer begin
    translate(0.7rand(BoundingBox()))
    pin = getworldposition()
end

label("you went ... ", :n, O, offset = 10)
label("... here", :n, pin, offset = 20)
arrow(O, pin)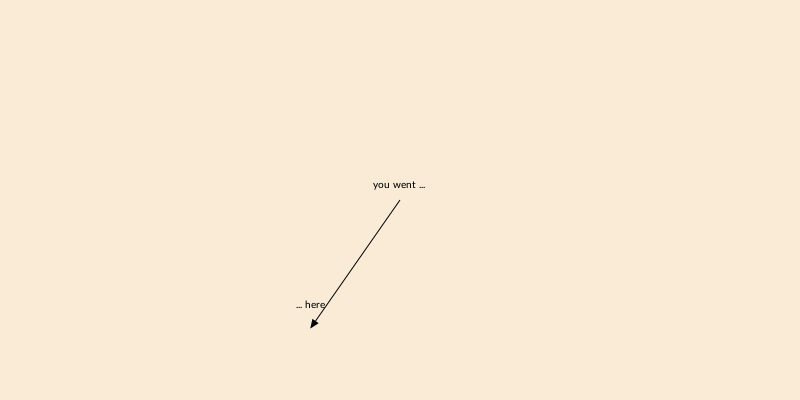
Coordinate conventions
In Luxor, by convention, the y axis points downwards, and the x axis points to the right.
There are basically two conventions for computer graphics:
most computer graphics systems (HTML, SVG, Processing, Cairo, Luxor, image processing, most GUIs, etc) use the “y downwards” convention
mathematical illustrations, such as graphs, figures, Plots.jl, plots, etc. use the “y upwards” convention
;fill-opacity:1;stroke:none;"/>
<path style="fill:none;stroke-width:1;stroke-linecap:butt;stroke-linejoin:miter;stroke:rgb(0%25,0%25,0%25);stroke-opacity:1;stroke-miterlimit:10;" d="M 250 225 L 250 34.238281 "/>
<path style=" stroke:none;fill-rule:nonzero;fill:rgb(0%25,0%25,0%25);fill-opacity:1;" d="M 246.171875 34.238281 L 250 25 L 253.828125 34.238281 "/>
<g style="fill:rgb(0%25,0%25,0%25);fill-opacity:1;">
<use xlink:href="%23glyph-9999810-1" x="270" y="25"/>
</g>
<path style="fill:none;stroke-width:1;stroke-linecap:butt;stroke-linejoin:miter;stroke:rgb(0%25,0%25,0%25);stroke-opacity:1;stroke-miterlimit:10;" d="M 250 225 L 440.761719 225 "/>
<path style=" stroke:none;fill-rule:nonzero;fill:rgb(0%25,0%25,0%25);fill-opacity:1;" d="M 440.761719 221.171875 L 450 225 L 440.761719 228.828125 "/>
<g style="fill:rgb(0%25,0%25,0%25);fill-opacity:1;">
<use xlink:href="%23glyph-9999810-2" x="450" y="245"/>
</g>
<g style="fill:rgb(0%25,0%25,0%25);fill-opacity:1;">
<use xlink:href="%23glyph-9999810-3" x="188.228" y="325"/>
<use xlink:href="%23glyph-9999810-4" x="201.428" y="325"/>
<use xlink:href="%23glyph-9999810-5" x="209.412" y="325"/>
<use xlink:href="%23glyph-9999810-6" x="215.18" y="325"/>
<use xlink:href="%23glyph-9999810-7" x="224.124" y="325"/>
<use xlink:href="%23glyph-9999810-8" x="231.068" y="325"/>
<use xlink:href="%23glyph-9999810-9" x="235.084" y="325"/>
<use xlink:href="%23glyph-9999810-1" x="239.14" y="325"/>
<use xlink:href="%23glyph-9999810-9" x="247.42" y="325"/>
<use xlink:href="%23glyph-9999810-10" x="251.476" y="325"/>
<use xlink:href="%23glyph-9999810-11" x="260.412" y="325"/>
<use xlink:href="%23glyph-9999810-12" x="269.404" y="325"/>
<use xlink:href="%23glyph-9999810-4" x="282.012" y="325"/>
<use xlink:href="%23glyph-9999810-13" x="289.996" y="325"/>
<use xlink:href="%23glyph-9999810-14" x="295.844" y="325"/>
<use xlink:href="%23glyph-9999810-7" x="304.828" y="325"/>
</g>
<g style="fill:rgb(0%25,0%25,0%25);fill-opacity:1;">
<use xlink:href="%23glyph-9999810-15" x="461.404" y="325"/>
<use xlink:href="%23glyph-9999810-16" x="469.052" y="325"/>
<use xlink:href="%23glyph-9999810-3" x="478.14" y="325"/>
<use xlink:href="%23glyph-9999810-11" x="491.34" y="325"/>
<use xlink:href="%23glyph-9999810-10" x="500.332" y="325"/>
<use xlink:href="%23glyph-9999810-5" x="509.268" y="325"/>
<use xlink:href="%23glyph-9999810-17" x="515.036" y="325"/>
<use xlink:href="%23glyph-9999810-18" x="518.908" y="325"/>
<use xlink:href="%23glyph-9999810-19" x="527.852" y="325"/>
<use xlink:href="%23glyph-9999810-8" x="536.196" y="325"/>
<use xlink:href="%23glyph-9999810-9" x="540.212" y="325"/>
<use xlink:href="%23glyph-9999810-1" x="544.268" y="325"/>
<use xlink:href="%23glyph-9999810-9" x="552.548" y="325"/>
<use xlink:href="%23glyph-9999810-14" x="556.604" y="325"/>
<use xlink:href="%23glyph-9999810-16" x="565.588" y="325"/>
<use xlink:href="%23glyph-9999810-12" x="574.676" y="325"/>
<use xlink:href="%23glyph-9999810-18" x="587.284" y="325"/>
<use xlink:href="%23glyph-9999810-12" x="596.228" y="325"/>
<use xlink:href="%23glyph-9999810-4" x="608.836" y="325"/>
<use xlink:href="%23glyph-9999810-13" x="616.82" y="325"/>
<use xlink:href="%23glyph-9999810-14" x="622.668" y="325"/>
<use xlink:href="%23glyph-9999810-7" x="631.652" y="325"/>
</g>
<path style="fill-rule:nonzero;fill:rgb(100%25,54.9%25,0%25);fill-opacity:0.5;stroke-width:0.25;stroke-linecap:butt;stroke-linejoin:miter;stroke:rgb(100%25,54.9%25,0%25);stroke-opacity:0.5;stroke-miterlimit:10;" d="M 550 225 L 550 205 L 750 205 L 750 225 Z M 550 225 "/>
<path style="fill-rule:nonzero;fill:rgb(100%25,54.9%25,0%25);fill-opacity:0.5;stroke-width:0.25;stroke-linecap:butt;stroke-linejoin:miter;stroke:rgb(100%25,54.9%25,0%25);stroke-opacity:0.5;stroke-miterlimit:10;" d="M 530 425 L 530 225 L 550 225 L 550 425 Z M 530 425 "/>
<path style="fill:none;stroke-width:0.25;stroke-linecap:butt;stroke-linejoin:miter;stroke:rgb(72.2%25,52.5%25,4.3%25);stroke-opacity:1;stroke-miterlimit:10;" d="M 550 225 L 550 220 "/>
<path style="fill:none;stroke-width:0.25;stroke-linecap:butt;stroke-linejoin:miter;stroke:rgb(72.2%25,52.5%25,4.3%25);stroke-opacity:1;stroke-miterlimit:10;" d="M 560 225 L 560 220 "/>
<path style="fill:none;stroke-width:0.25;stroke-linecap:butt;stroke-linejoin:miter;stroke:rgb(72.2%25,52.5%25,4.3%25);stroke-opacity:1;stroke-miterlimit:10;" d="M 570 225 L 570 220 "/>
<path style="fill:none;stroke-width:0.25;stroke-linecap:butt;stroke-linejoin:miter;stroke:rgb(72.2%25,52.5%25,4.3%25);stroke-opacity:1;stroke-miterlimit:10;" d="M 580 225 L 580 220 "/>
<path style="fill:none;stroke-width:0.25;stroke-linecap:butt;stroke-linejoin:miter;stroke:rgb(72.2%25,52.5%25,4.3%25);stroke-opacity:1;stroke-miterlimit:10;" d="M 590 225 L 590 220 "/>
<path style="fill:none;stroke-width:0.25;stroke-linecap:butt;stroke-linejoin:miter;stroke:rgb(72.2%25,52.5%25,4.3%25);stroke-opacity:1;stroke-miterlimit:10;" d="M 600 225 L 600 220 "/>
<path style="fill:none;stroke-width:0.25;stroke-linecap:butt;stroke-linejoin:miter;stroke:rgb(72.2%25,52.5%25,4.3%25);stroke-opacity:1;stroke-miterlimit:10;" d="M 610 225 L 610 220 "/>
<path style="fill:none;stroke-width:0.25;stroke-linecap:butt;stroke-linejoin:miter;stroke:rgb(72.2%25,52.5%25,4.3%25);stroke-opacity:1;stroke-miterlimit:10;" d="M 620 225 L 620 220 "/>
<path style="fill:none;stroke-width:0.25;stroke-linecap:butt;stroke-linejoin:miter;stroke:rgb(72.2%25,52.5%25,4.3%25);stroke-opacity:1;stroke-miterlimit:10;" d="M 630 225 L 630 220 "/>
<path style="fill:none;stroke-width:0.25;stroke-linecap:butt;stroke-linejoin:miter;stroke:rgb(72.2%25,52.5%25,4.3%25);stroke-opacity:1;stroke-miterlimit:10;" d="M 640 225 L 640 220 "/>
<path style="fill:none;stroke-width:0.25;stroke-linecap:butt;stroke-linejoin:miter;stroke:rgb(72.2%25,52.5%25,4.3%25);stroke-opacity:1;stroke-miterlimit:10;" d="M 650 225 L 650 220 "/>
<path style="fill:none;stroke-width:0.25;stroke-linecap:butt;stroke-linejoin:miter;stroke:rgb(72.2%25,52.5%25,4.3%25);stroke-opacity:1;stroke-miterlimit:10;" d="M 660 225 L 660 220 "/>
<path style="fill:none;stroke-width:0.25;stroke-linecap:butt;stroke-linejoin:miter;stroke:rgb(72.2%25,52.5%25,4.3%25);stroke-opacity:1;stroke-miterlimit:10;" d="M 670 225 L 670 220 "/>
<path style="fill:none;stroke-width:0.25;stroke-linecap:butt;stroke-linejoin:miter;stroke:rgb(72.2%25,52.5%25,4.3%25);stroke-opacity:1;stroke-miterlimit:10;" d="M 680 225 L 680 220 "/>
<path style="fill:none;stroke-width:0.25;stroke-linecap:butt;stroke-linejoin:miter;stroke:rgb(72.2%25,52.5%25,4.3%25);stroke-opacity:1;stroke-miterlimit:10;" d="M 690 225 L 690 220 "/>
<path style="fill:none;stroke-width:0.25;stroke-linecap:butt;stroke-linejoin:miter;stroke:rgb(72.2%25,52.5%25,4.3%25);stroke-opacity:1;stroke-miterlimit:10;" d="M 700 225 L 700 220 "/>
<path style="fill:none;stroke-width:0.25;stroke-linecap:butt;stroke-linejoin:miter;stroke:rgb(72.2%25,52.5%25,4.3%25);stroke-opacity:1;stroke-miterlimit:10;" d="M 710 225 L 710 220 "/>
<path style="fill:none;stroke-width:0.25;stroke-linecap:butt;stroke-linejoin:miter;stroke:rgb(72.2%25,52.5%25,4.3%25);stroke-opacity:1;stroke-miterlimit:10;" d="M 720 225 L 720 220 "/>
<path style="fill:none;stroke-width:0.25;stroke-linecap:butt;stroke-linejoin:miter;stroke:rgb(72.2%25,52.5%25,4.3%25);stroke-opacity:1;stroke-miterlimit:10;" d="M 730 225 L 730 220 "/>
<path style="fill:none;stroke-width:0.25;stroke-linecap:butt;stroke-linejoin:miter;stroke:rgb(72.2%25,52.5%25,4.3%25);stroke-opacity:1;stroke-miterlimit:10;" d="M 740 225 L 740 220 "/>
<path style="fill:none;stroke-width:0.25;stroke-linecap:butt;stroke-linejoin:miter;stroke:rgb(72.2%25,52.5%25,4.3%25);stroke-opacity:1;stroke-miterlimit:10;" d="M 750 225 L 750 220 "/>
<path style="fill:none;stroke-width:0.25;stroke-linecap:butt;stroke-linejoin:miter;stroke:rgb(72.2%25,52.5%25,4.3%25);stroke-opacity:1;stroke-miterlimit:10;" d="M 545 225 L 550 225 "/>
<path style="fill:none;stroke-width:0.25;stroke-linecap:butt;stroke-linejoin:miter;stroke:rgb(72.2%25,52.5%25,4.3%25);stroke-opacity:1;stroke-miterlimit:10;" d="M 545 235 L 550 235 "/>
<path style="fill:none;stroke-width:0.25;stroke-linecap:butt;stroke-linejoin:miter;stroke:rgb(72.2%25,52.5%25,4.3%25);stroke-opacity:1;stroke-miterlimit:10;" d="M 545 245 L 550 245 "/>
<path style="fill:none;stroke-width:0.25;stroke-linecap:butt;stroke-linejoin:miter;stroke:rgb(72.2%25,52.5%25,4.3%25);stroke-opacity:1;stroke-miterlimit:10;" d="M 545 255 L 550 255 "/>
<path style="fill:none;stroke-width:0.25;stroke-linecap:butt;stroke-linejoin:miter;stroke:rgb(72.2%25,52.5%25,4.3%25);stroke-opacity:1;stroke-miterlimit:10;" d="M 545 265 L 550 265 "/>
<path style="fill:none;stroke-width:0.25;stroke-linecap:butt;stroke-linejoin:miter;stroke:rgb(72.2%25,52.5%25,4.3%25);stroke-opacity:1;stroke-miterlimit:10;" d="M 545 275 L 550 275 "/>
<path style="fill:none;stroke-width:0.25;stroke-linecap:butt;stroke-linejoin:miter;stroke:rgb(72.2%25,52.5%25,4.3%25);stroke-opacity:1;stroke-miterlimit:10;" d="M 545 285 L 550 285 "/>
<path style="fill:none;stroke-width:0.25;stroke-linecap:butt;stroke-linejoin:miter;stroke:rgb(72.2%25,52.5%25,4.3%25);stroke-opacity:1;stroke-miterlimit:10;" d="M 545 295 L 550 295 "/>
<path style="fill:none;stroke-width:0.25;stroke-linecap:butt;stroke-linejoin:miter;stroke:rgb(72.2%25,52.5%25,4.3%25);stroke-opacity:1;stroke-miterlimit:10;" d="M 545 305 L 550 305 "/>
<path style="fill:none;stroke-width:0.25;stroke-linecap:butt;stroke-linejoin:miter;stroke:rgb(72.2%25,52.5%25,4.3%25);stroke-opacity:1;stroke-miterlimit:10;" d="M 545 315 L 550 315 "/>
<path style="fill:none;stroke-width:0.25;stroke-linecap:butt;stroke-linejoin:miter;stroke:rgb(72.2%25,52.5%25,4.3%25);stroke-opacity:1;stroke-miterlimit:10;" d="M 545 325 L 550 325 "/>
<path style="fill:none;stroke-width:0.25;stroke-linecap:butt;stroke-linejoin:miter;stroke:rgb(72.2%25,52.5%25,4.3%25);stroke-opacity:1;stroke-miterlimit:10;" d="M 545 335 L 550 335 "/>
<path style="fill:none;stroke-width:0.25;stroke-linecap:butt;stroke-linejoin:miter;stroke:rgb(72.2%25,52.5%25,4.3%25);stroke-opacity:1;stroke-miterlimit:10;" d="M 545 345 L 550 345 "/>
<path style="fill:none;stroke-width:0.25;stroke-linecap:butt;stroke-linejoin:miter;stroke:rgb(72.2%25,52.5%25,4.3%25);stroke-opacity:1;stroke-miterlimit:10;" d="M 545 355 L 550 355 "/>
<path style="fill:none;stroke-width:0.25;stroke-linecap:butt;stroke-linejoin:miter;stroke:rgb(72.2%25,52.5%25,4.3%25);stroke-opacity:1;stroke-miterlimit:10;" d="M 545 365 L 550 365 "/>
<path style="fill:none;stroke-width:0.25;stroke-linecap:butt;stroke-linejoin:miter;stroke:rgb(72.2%25,52.5%25,4.3%25);stroke-opacity:1;stroke-miterlimit:10;" d="M 545 375 L 550 375 "/>
<path style="fill:none;stroke-width:0.25;stroke-linecap:butt;stroke-linejoin:miter;stroke:rgb(72.2%25,52.5%25,4.3%25);stroke-opacity:1;stroke-miterlimit:10;" d="M 545 385 L 550 385 "/>
<path style="fill:none;stroke-width:0.25;stroke-linecap:butt;stroke-linejoin:miter;stroke:rgb(72.2%25,52.5%25,4.3%25);stroke-opacity:1;stroke-miterlimit:10;" d="M 545 395 L 550 395 "/>
<path style="fill:none;stroke-width:0.25;stroke-linecap:butt;stroke-linejoin:miter;stroke:rgb(72.2%25,52.5%25,4.3%25);stroke-opacity:1;stroke-miterlimit:10;" d="M 545 405 L 550 405 "/>
<path style="fill:none;stroke-width:0.25;stroke-linecap:butt;stroke-linejoin:miter;stroke:rgb(72.2%25,52.5%25,4.3%25);stroke-opacity:1;stroke-miterlimit:10;" d="M 545 415 L 550 415 "/>
<path style="fill:none;stroke-width:0.25;stroke-linecap:butt;stroke-linejoin:miter;stroke:rgb(72.2%25,52.5%25,4.3%25);stroke-opacity:1;stroke-miterlimit:10;" d="M 545 425 L 550 425 "/>
<path style="fill:none;stroke-width:0.25;stroke-linecap:butt;stroke-linejoin:miter;stroke:rgb(72.2%25,52.5%25,4.3%25);stroke-opacity:1;stroke-miterlimit:10;" d="M 550 225 L 550 221.667969 "/>
<path style="fill:none;stroke-width:0.25;stroke-linecap:butt;stroke-linejoin:miter;stroke:rgb(72.2%25,52.5%25,4.3%25);stroke-opacity:1;stroke-miterlimit:10;" d="M 555 225 L 555 221.667969 "/>
<path style="fill:none;stroke-width:0.25;stroke-linecap:butt;stroke-linejoin:miter;stroke:rgb(72.2%25,52.5%25,4.3%25);stroke-opacity:1;stroke-miterlimit:10;" d="M 560 225 L 560 221.667969 "/>
<path style="fill:none;stroke-width:0.25;stroke-linecap:butt;stroke-linejoin:miter;stroke:rgb(72.2%25,52.5%25,4.3%25);stroke-opacity:1;stroke-miterlimit:10;" d="M 565 225 L 565 221.667969 "/>
<path style="fill:none;stroke-width:0.25;stroke-linecap:butt;stroke-linejoin:miter;stroke:rgb(72.2%25,52.5%25,4.3%25);stroke-opacity:1;stroke-miterlimit:10;" d="M 570 225 L 570 221.667969 "/>
<path style="fill:none;stroke-width:0.25;stroke-linecap:butt;stroke-linejoin:miter;stroke:rgb(72.2%25,52.5%25,4.3%25);stroke-opacity:1;stroke-miterlimit:10;" d="M 575 225 L 575 221.667969 "/>
<path style="fill:none;stroke-width:0.25;stroke-linecap:butt;stroke-linejoin:miter;stroke:rgb(72.2%25,52.5%25,4.3%25);stroke-opacity:1;stroke-miterlimit:10;" d="M 580 225 L 580 221.667969 "/>
<path style="fill:none;stroke-width:0.25;stroke-linecap:butt;stroke-linejoin:miter;stroke:rgb(72.2%25,52.5%25,4.3%25);stroke-opacity:1;stroke-miterlimit:10;" d="M 585 225 L 585 221.667969 "/>
<path style="fill:none;stroke-width:0.25;stroke-linecap:butt;stroke-linejoin:miter;stroke:rgb(72.2%25,52.5%25,4.3%25);stroke-opacity:1;stroke-miterlimit:10;" d="M 590 225 L 590 221.667969 "/>
<path style="fill:none;stroke-width:0.25;stroke-linecap:butt;stroke-linejoin:miter;stroke:rgb(72.2%25,52.5%25,4.3%25);stroke-opacity:1;stroke-miterlimit:10;" d="M 595 225 L 595 221.667969 "/>
<path style="fill:none;stroke-width:0.25;stroke-linecap:butt;stroke-linejoin:miter;stroke:rgb(72.2%25,52.5%25,4.3%25);stroke-opacity:1;stroke-miterlimit:10;" d="M 600 225 L 600 221.667969 "/>
<path style="fill:none;stroke-width:0.25;stroke-linecap:butt;stroke-linejoin:miter;stroke:rgb(72.2%25,52.5%25,4.3%25);stroke-opacity:1;stroke-miterlimit:10;" d="M 605 225 L 605 221.667969 "/>
<path style="fill:none;stroke-width:0.25;stroke-linecap:butt;stroke-linejoin:miter;stroke:rgb(72.2%25,52.5%25,4.3%25);stroke-opacity:1;stroke-miterlimit:10;" d="M 610 225 L 610 221.667969 "/>
<path style="fill:none;stroke-width:0.25;stroke-linecap:butt;stroke-linejoin:miter;stroke:rgb(72.2%25,52.5%25,4.3%25);stroke-opacity:1;stroke-miterlimit:10;" d="M 615 225 L 615 221.667969 "/>
<path style="fill:none;stroke-width:0.25;stroke-linecap:butt;stroke-linejoin:miter;stroke:rgb(72.2%25,52.5%25,4.3%25);stroke-opacity:1;stroke-miterlimit:10;" d="M 620 225 L 620 221.667969 "/>
<path style="fill:none;stroke-width:0.25;stroke-linecap:butt;stroke-linejoin:miter;stroke:rgb(72.2%25,52.5%25,4.3%25);stroke-opacity:1;stroke-miterlimit:10;" d="M 625 225 L 625 221.667969 "/>
<path style="fill:none;stroke-width:0.25;stroke-linecap:butt;stroke-linejoin:miter;stroke:rgb(72.2%25,52.5%25,4.3%25);stroke-opacity:1;stroke-miterlimit:10;" d="M 630 225 L 630 221.667969 "/>
<path style="fill:none;stroke-width:0.25;stroke-linecap:butt;stroke-linejoin:miter;stroke:rgb(72.2%25,52.5%25,4.3%25);stroke-opacity:1;stroke-miterlimit:10;" d="M 635 225 L 635 221.667969 "/>
<path style="fill:none;stroke-width:0.25;stroke-linecap:butt;stroke-linejoin:miter;stroke:rgb(72.2%25,52.5%25,4.3%25);stroke-opacity:1;stroke-miterlimit:10;" d="M 640 225 L 640 221.667969 "/>
<path style="fill:none;stroke-width:0.25;stroke-linecap:butt;stroke-linejoin:miter;stroke:rgb(72.2%25,52.5%25,4.3%25);stroke-opacity:1;stroke-miterlimit:10;" d="M 645 225 L 645 221.667969 "/>
<path style="fill:none;stroke-width:0.25;stroke-linecap:butt;stroke-linejoin:miter;stroke:rgb(72.2%25,52.5%25,4.3%25);stroke-opacity:1;stroke-miterlimit:10;" d="M 650 225 L 650 221.667969 "/>
<path style="fill:none;stroke-width:0.25;stroke-linecap:butt;stroke-linejoin:miter;stroke:rgb(72.2%25,52.5%25,4.3%25);stroke-opacity:1;stroke-miterlimit:10;" d="M 655 225 L 655 221.667969 "/>
<path style="fill:none;stroke-width:0.25;stroke-linecap:butt;stroke-linejoin:miter;stroke:rgb(72.2%25,52.5%25,4.3%25);stroke-opacity:1;stroke-miterlimit:10;" d="M 660 225 L 660 221.667969 "/>
<path style="fill:none;stroke-width:0.25;stroke-linecap:butt;stroke-linejoin:miter;stroke:rgb(72.2%25,52.5%25,4.3%25);stroke-opacity:1;stroke-miterlimit:10;" d="M 665 225 L 665 221.667969 "/>
<path style="fill:none;stroke-width:0.25;stroke-linecap:butt;stroke-linejoin:miter;stroke:rgb(72.2%25,52.5%25,4.3%25);stroke-opacity:1;stroke-miterlimit:10;" d="M 670 225 L 670 221.667969 "/>
<path style="fill:none;stroke-width:0.25;stroke-linecap:butt;stroke-linejoin:miter;stroke:rgb(72.2%25,52.5%25,4.3%25);stroke-opacity:1;stroke-miterlimit:10;" d="M 675 225 L 675 221.667969 "/>
<path style="fill:none;stroke-width:0.25;stroke-linecap:butt;stroke-linejoin:miter;stroke:rgb(72.2%25,52.5%25,4.3%25);stroke-opacity:1;stroke-miterlimit:10;" d="M 680 225 L 680 221.667969 "/>
<path style="fill:none;stroke-width:0.25;stroke-linecap:butt;stroke-linejoin:miter;stroke:rgb(72.2%25,52.5%25,4.3%25);stroke-opacity:1;stroke-miterlimit:10;" d="M 685 225 L 685 221.667969 "/>
<path style="fill:none;stroke-width:0.25;stroke-linecap:butt;stroke-linejoin:miter;stroke:rgb(72.2%25,52.5%25,4.3%25);stroke-opacity:1;stroke-miterlimit:10;" d="M 690 225 L 690 221.667969 "/>
<path style="fill:none;stroke-width:0.25;stroke-linecap:butt;stroke-linejoin:miter;stroke:rgb(72.2%25,52.5%25,4.3%25);stroke-opacity:1;stroke-miterlimit:10;" d="M 695 225 L 695 221.667969 "/>
<path style="fill:none;stroke-width:0.25;stroke-linecap:butt;stroke-linejoin:miter;stroke:rgb(72.2%25,52.5%25,4.3%25);stroke-opacity:1;stroke-miterlimit:10;" d="M 700 225 L 700 221.667969 "/>
<path style="fill:none;stroke-width:0.25;stroke-linecap:butt;stroke-linejoin:miter;stroke:rgb(72.2%25,52.5%25,4.3%25);stroke-opacity:1;stroke-miterlimit:10;" d="M 705 225 L 705 221.667969 "/>
<path style="fill:none;stroke-width:0.25;stroke-linecap:butt;stroke-linejoin:miter;stroke:rgb(72.2%25,52.5%25,4.3%25);stroke-opacity:1;stroke-miterlimit:10;" d="M 710 225 L 710 221.667969 "/>
<path style="fill:none;stroke-width:0.25;stroke-linecap:butt;stroke-linejoin:miter;stroke:rgb(72.2%25,52.5%25,4.3%25);stroke-opacity:1;stroke-miterlimit:10;" d="M 715 225 L 715 221.667969 "/>
<path style="fill:none;stroke-width:0.25;stroke-linecap:butt;stroke-linejoin:miter;stroke:rgb(72.2%25,52.5%25,4.3%25);stroke-opacity:1;stroke-miterlimit:10;" d="M 720 225 L 720 221.667969 "/>
<path style="fill:none;stroke-width:0.25;stroke-linecap:butt;stroke-linejoin:miter;stroke:rgb(72.2%25,52.5%25,4.3%25);stroke-opacity:1;stroke-miterlimit:10;" d="M 725 225 L 725 221.667969 "/>
<path style="fill:none;stroke-width:0.25;stroke-linecap:butt;stroke-linejoin:miter;stroke:rgb(72.2%25,52.5%25,4.3%25);stroke-opacity:1;stroke-miterlimit:10;" d="M 730 225 L 730 221.667969 "/>
<path style="fill:none;stroke-width:0.25;stroke-linecap:butt;stroke-linejoin:miter;stroke:rgb(72.2%25,52.5%25,4.3%25);stroke-opacity:1;stroke-miterlimit:10;" d="M 735 225 L 735 221.667969 "/>
<path style="fill:none;stroke-width:0.25;stroke-linecap:butt;stroke-linejoin:miter;stroke:rgb(72.2%25,52.5%25,4.3%25);stroke-opacity:1;stroke-miterlimit:10;" d="M 740 225 L 740 221.667969 "/>
<path style="fill:none;stroke-width:0.25;stroke-linecap:butt;stroke-linejoin:miter;stroke:rgb(72.2%25,52.5%25,4.3%25);stroke-opacity:1;stroke-miterlimit:10;" d="M 745 225 L 745 221.667969 "/>
<path style="fill:none;stroke-width:0.25;stroke-linecap:butt;stroke-linejoin:miter;stroke:rgb(72.2%25,52.5%25,4.3%25);stroke-opacity:1;stroke-miterlimit:10;" d="M 750 225 L 750 221.667969 "/>
<path style="fill:none;stroke-width:0.25;stroke-linecap:butt;stroke-linejoin:miter;stroke:rgb(72.2%25,52.5%25,4.3%25);stroke-opacity:1;stroke-miterlimit:10;" d="M 546.667969 225 L 550 225 "/>
<path style="fill:none;stroke-width:0.25;stroke-linecap:butt;stroke-linejoin:miter;stroke:rgb(72.2%25,52.5%25,4.3%25);stroke-opacity:1;stroke-miterlimit:10;" d="M 546.667969 230 L 550 230 "/>
<path style="fill:none;stroke-width:0.25;stroke-linecap:butt;stroke-linejoin:miter;stroke:rgb(72.2%25,52.5%25,4.3%25);stroke-opacity:1;stroke-miterlimit:10;" d="M 546.667969 235 L 550 235 "/>
<path style="fill:none;stroke-width:0.25;stroke-linecap:butt;stroke-linejoin:miter;stroke:rgb(72.2%25,52.5%25,4.3%25);stroke-opacity:1;stroke-miterlimit:10;" d="M 546.667969 240 L 550 240 "/>
<path style="fill:none;stroke-width:0.25;stroke-linecap:butt;stroke-linejoin:miter;stroke:rgb(72.2%25,52.5%25,4.3%25);stroke-opacity:1;stroke-miterlimit:10;" d="M 546.667969 245 L 550 245 "/>
<path style="fill:none;stroke-width:0.25;stroke-linecap:butt;stroke-linejoin:miter;stroke:rgb(72.2%25,52.5%25,4.3%25);stroke-opacity:1;stroke-miterlimit:10;" d="M 546.667969 250 L 550 250 "/>
<path style="fill:none;stroke-width:0.25;stroke-linecap:butt;stroke-linejoin:miter;stroke:rgb(72.2%25,52.5%25,4.3%25);stroke-opacity:1;stroke-miterlimit:10;" d="M 546.667969 255 L 550 255 "/>
<path style="fill:none;stroke-width:0.25;stroke-linecap:butt;stroke-linejoin:miter;stroke:rgb(72.2%25,52.5%25,4.3%25);stroke-opacity:1;stroke-miterlimit:10;" d="M 546.667969 260 L 550 260 "/>
<path style="fill:none;stroke-width:0.25;stroke-linecap:butt;stroke-linejoin:miter;stroke:rgb(72.2%25,52.5%25,4.3%25);stroke-opacity:1;stroke-miterlimit:10;" d="M 546.667969 265 L 550 265 "/>
<path style="fill:none;stroke-width:0.25;stroke-linecap:butt;stroke-linejoin:miter;stroke:rgb(72.2%25,52.5%25,4.3%25);stroke-opacity:1;stroke-miterlimit:10;" d="M 546.667969 270 L 550 270 "/>
<path style="fill:none;stroke-width:0.25;stroke-linecap:butt;stroke-linejoin:miter;stroke:rgb(72.2%25,52.5%25,4.3%25);stroke-opacity:1;stroke-miterlimit:10;" d="M 546.667969 275 L 550 275 "/>
<path style="fill:none;stroke-width:0.25;stroke-linecap:butt;stroke-linejoin:miter;stroke:rgb(72.2%25,52.5%25,4.3%25);stroke-opacity:1;stroke-miterlimit:10;" d="M 546.667969 280 L 550 280 "/>
<path style="fill:none;stroke-width:0.25;stroke-linecap:butt;stroke-linejoin:miter;stroke:rgb(72.2%25,52.5%25,4.3%25);stroke-opacity:1;stroke-miterlimit:10;" d="M 546.667969 285 L 550 285 "/>
<path style="fill:none;stroke-width:0.25;stroke-linecap:butt;stroke-linejoin:miter;stroke:rgb(72.2%25,52.5%25,4.3%25);stroke-opacity:1;stroke-miterlimit:10;" d="M 546.667969 290 L 550 290 "/>
<path style="fill:none;stroke-width:0.25;stroke-linecap:butt;stroke-linejoin:miter;stroke:rgb(72.2%25,52.5%25,4.3%25);stroke-opacity:1;stroke-miterlimit:10;" d="M 546.667969 295 L 550 295 "/>
<path style="fill:none;stroke-width:0.25;stroke-linecap:butt;stroke-linejoin:miter;stroke:rgb(72.2%25,52.5%25,4.3%25);stroke-opacity:1;stroke-miterlimit:10;" d="M 546.667969 300 L 550 300 "/>
<path style="fill:none;stroke-width:0.25;stroke-linecap:butt;stroke-linejoin:miter;stroke:rgb(72.2%25,52.5%25,4.3%25);stroke-opacity:1;stroke-miterlimit:10;" d="M 546.667969 305 L 550 305 "/>
<path style="fill:none;stroke-width:0.25;stroke-linecap:butt;stroke-linejoin:miter;stroke:rgb(72.2%25,52.5%25,4.3%25);stroke-opacity:1;stroke-miterlimit:10;" d="M 546.667969 310 L 550 310 "/>
<path style="fill:none;stroke-width:0.25;stroke-linecap:butt;stroke-linejoin:miter;stroke:rgb(72.2%25,52.5%25,4.3%25);stroke-opacity:1;stroke-miterlimit:10;" d="M 546.667969 315 L 550 315 "/>
<path style="fill:none;stroke-width:0.25;stroke-linecap:butt;stroke-linejoin:miter;stroke:rgb(72.2%25,52.5%25,4.3%25);stroke-opacity:1;stroke-miterlimit:10;" d="M 546.667969 320 L 550 320 "/>
<path style="fill:none;stroke-width:0.25;stroke-linecap:butt;stroke-linejoin:miter;stroke:rgb(72.2%25,52.5%25,4.3%25);stroke-opacity:1;stroke-miterlimit:10;" d="M 546.667969 325 L 550 325 "/>
<path style="fill:none;stroke-width:0.25;stroke-linecap:butt;stroke-linejoin:miter;stroke:rgb(72.2%25,52.5%25,4.3%25);stroke-opacity:1;stroke-miterlimit:10;" d="M 546.667969 330 L 550 330 "/>
<path style="fill:none;stroke-width:0.25;stroke-linecap:butt;stroke-linejoin:miter;stroke:rgb(72.2%25,52.5%25,4.3%25);stroke-opacity:1;stroke-miterlimit:10;" d="M 546.667969 335 L 550 335 "/>
<path style="fill:none;stroke-width:0.25;stroke-linecap:butt;stroke-linejoin:miter;stroke:rgb(72.2%25,52.5%25,4.3%25);stroke-opacity:1;stroke-miterlimit:10;" d="M 546.667969 340 L 550 340 "/>
<path style="fill:none;stroke-width:0.25;stroke-linecap:butt;stroke-linejoin:miter;stroke:rgb(72.2%25,52.5%25,4.3%25);stroke-opacity:1;stroke-miterlimit:10;" d="M 546.667969 345 L 550 345 "/>
<path style="fill:none;stroke-width:0.25;stroke-linecap:butt;stroke-linejoin:miter;stroke:rgb(72.2%25,52.5%25,4.3%25);stroke-opacity:1;stroke-miterlimit:10;" d="M 546.667969 350 L 550 350 "/>
<path style="fill:none;stroke-width:0.25;stroke-linecap:butt;stroke-linejoin:miter;stroke:rgb(72.2%25,52.5%25,4.3%25);stroke-opacity:1;stroke-miterlimit:10;" d="M 546.667969 355 L 550 355 "/>
<path style="fill:none;stroke-width:0.25;stroke-linecap:butt;stroke-linejoin:miter;stroke:rgb(72.2%25,52.5%25,4.3%25);stroke-opacity:1;stroke-miterlimit:10;" d="M 546.667969 360 L 550 360 "/>
<path style="fill:none;stroke-width:0.25;stroke-linecap:butt;stroke-linejoin:miter;stroke:rgb(72.2%25,52.5%25,4.3%25);stroke-opacity:1;stroke-miterlimit:10;" d="M 546.667969 365 L 550 365 "/>
<path style="fill:none;stroke-width:0.25;stroke-linecap:butt;stroke-linejoin:miter;stroke:rgb(72.2%25,52.5%25,4.3%25);stroke-opacity:1;stroke-miterlimit:10;" d="M 546.667969 370 L 550 370 "/>
<path style="fill:none;stroke-width:0.25;stroke-linecap:butt;stroke-linejoin:miter;stroke:rgb(72.2%25,52.5%25,4.3%25);stroke-opacity:1;stroke-miterlimit:10;" d="M 546.667969 375 L 550 375 "/>
<path style="fill:none;stroke-width:0.25;stroke-linecap:butt;stroke-linejoin:miter;stroke:rgb(72.2%25,52.5%25,4.3%25);stroke-opacity:1;stroke-miterlimit:10;" d="M 546.667969 380 L 550 380 "/>
<path style="fill:none;stroke-width:0.25;stroke-linecap:butt;stroke-linejoin:miter;stroke:rgb(72.2%25,52.5%25,4.3%25);stroke-opacity:1;stroke-miterlimit:10;" d="M 546.667969 385 L 550 385 "/>
<path style="fill:none;stroke-width:0.25;stroke-linecap:butt;stroke-linejoin:miter;stroke:rgb(72.2%25,52.5%25,4.3%25);stroke-opacity:1;stroke-miterlimit:10;" d="M 546.667969 390 L 550 390 "/>
<path style="fill:none;stroke-width:0.25;stroke-linecap:butt;stroke-linejoin:miter;stroke:rgb(72.2%25,52.5%25,4.3%25);stroke-opacity:1;stroke-miterlimit:10;" d="M 546.667969 395 L 550 395 "/>
<path style="fill:none;stroke-width:0.25;stroke-linecap:butt;stroke-linejoin:miter;stroke:rgb(72.2%25,52.5%25,4.3%25);stroke-opacity:1;stroke-miterlimit:10;" d="M 546.667969 400 L 550 400 "/>
<path style="fill:none;stroke-width:0.25;stroke-linecap:butt;stroke-linejoin:miter;stroke:rgb(72.2%25,52.5%25,4.3%25);stroke-opacity:1;stroke-miterlimit:10;" d="M 546.667969 405 L 550 405 "/>
<path style="fill:none;stroke-width:0.25;stroke-linecap:butt;stroke-linejoin:miter;stroke:rgb(72.2%25,52.5%25,4.3%25);stroke-opacity:1;stroke-miterlimit:10;" d="M 546.667969 410 L 550 410 "/>
<path style="fill:none;stroke-width:0.25;stroke-linecap:butt;stroke-linejoin:miter;stroke:rgb(72.2%25,52.5%25,4.3%25);stroke-opacity:1;stroke-miterlimit:10;" d="M 546.667969 415 L 550 415 "/>
<path style="fill:none;stroke-width:0.25;stroke-linecap:butt;stroke-linejoin:miter;stroke:rgb(72.2%25,52.5%25,4.3%25);stroke-opacity:1;stroke-miterlimit:10;" d="M 546.667969 420 L 550 420 "/>
<path style="fill:none;stroke-width:0.25;stroke-linecap:butt;stroke-linejoin:miter;stroke:rgb(72.2%25,52.5%25,4.3%25);stroke-opacity:1;stroke-miterlimit:10;" d="M 546.667969 425 L 550 425 "/>
<g style="fill:rgb(72.2%25,52.5%25,4.3%25);fill-opacity:1;">
<use xlink:href="%23glyph-9999811-1" x="557.738" y="218.333333"/>
<use xlink:href="%23glyph-9999811-2" x="558.898" y="218.333333"/>
</g>
<g style="fill:rgb(72.2%25,52.5%25,4.3%25);fill-opacity:1;">
<use xlink:href="%23glyph-9999811-3" x="567.738" y="218.333333"/>
<use xlink:href="%23glyph-9999811-2" x="568.898" y="218.333333"/>
</g>
<g style="fill:rgb(72.2%25,52.5%25,4.3%25);fill-opacity:1;">
<use xlink:href="%23glyph-9999811-4" x="577.738" y="218.333333"/>
<use xlink:href="%23glyph-9999811-2" x="578.898" y="218.333333"/>
</g>
<g style="fill:rgb(72.2%25,52.5%25,4.3%25);fill-opacity:1;">
<use xlink:href="%23glyph-9999811-5" x="587.738" y="218.333333"/>
<use xlink:href="%23glyph-9999811-2" x="588.898" y="218.333333"/>
</g>
<g style="fill:rgb(72.2%25,52.5%25,4.3%25);fill-opacity:1;">
<use xlink:href="%23glyph-9999811-6" x="597.738" y="218.333333"/>
<use xlink:href="%23glyph-9999811-2" x="598.898" y="218.333333"/>
</g>
<g style="fill:rgb(72.2%25,52.5%25,4.3%25);fill-opacity:1;">
<use xlink:href="%23glyph-9999811-7" x="607.738" y="218.333333"/>
<use xlink:href="%23glyph-9999811-2" x="608.898" y="218.333333"/>
</g>
<g style="fill:rgb(72.2%25,52.5%25,4.3%25);fill-opacity:1;">
<use xlink:href="%23glyph-9999811-8" x="617.738" y="218.333333"/>
<use xlink:href="%23glyph-9999811-2" x="618.898" y="218.333333"/>
</g>
<g style="fill:rgb(72.2%25,52.5%25,4.3%25);fill-opacity:1;">
<use xlink:href="%23glyph-9999811-9" x="627.738" y="218.333333"/>
<use xlink:href="%23glyph-9999811-2" x="628.898" y="218.333333"/>
</g>
<g style="fill:rgb(72.2%25,52.5%25,4.3%25);fill-opacity:1;">
<use xlink:href="%23glyph-9999811-10" x="637.738" y="218.333333"/>
<use xlink:href="%23glyph-9999811-2" x="638.898" y="218.333333"/>
</g>
<g style="fill:rgb(72.2%25,52.5%25,4.3%25);fill-opacity:1;">
<use xlink:href="%23glyph-9999811-1" x="646.578" y="218.333333"/>
<use xlink:href="%23glyph-9999811-2" x="647.738" y="218.333333"/>
<use xlink:href="%23glyph-9999811-2" x="648.898" y="218.333333"/>
</g>
<g style="fill:rgb(72.2%25,52.5%25,4.3%25);fill-opacity:1;">
<use xlink:href="%23glyph-9999811-1" x="656.578" y="218.333333"/>
<use xlink:href="%23glyph-9999811-1" x="657.738" y="218.333333"/>
<use xlink:href="%23glyph-9999811-2" x="658.898" y="218.333333"/>
</g>
<g style="fill:rgb(72.2%25,52.5%25,4.3%25);fill-opacity:1;">
<use xlink:href="%23glyph-9999811-1" x="666.578" y="218.333333"/>
<use xlink:href="%23glyph-9999811-3" x="667.738" y="218.333333"/>
<use xlink:href="%23glyph-9999811-2" x="668.898" y="218.333333"/>
</g>
<g style="fill:rgb(72.2%25,52.5%25,4.3%25);fill-opacity:1;">
<use xlink:href="%23glyph-9999811-1" x="676.578" y="218.333333"/>
<use xlink:href="%23glyph-9999811-4" x="677.738" y="218.333333"/>
<use xlink:href="%23glyph-9999811-2" x="678.898" y="218.333333"/>
</g>
<g style="fill:rgb(72.2%25,52.5%25,4.3%25);fill-opacity:1;">
<use xlink:href="%23glyph-9999811-1" x="686.578" y="218.333333"/>
<use xlink:href="%23glyph-9999811-5" x="687.738" y="218.333333"/>
<use xlink:href="%23glyph-9999811-2" x="688.898" y="218.333333"/>
</g>
<g style="fill:rgb(72.2%25,52.5%25,4.3%25);fill-opacity:1;">
<use xlink:href="%23glyph-9999811-1" x="696.578" y="218.333333"/>
<use xlink:href="%23glyph-9999811-6" x="697.738" y="218.333333"/>
<use xlink:href="%23glyph-9999811-2" x="698.898" y="218.333333"/>
</g>
<g style="fill:rgb(72.2%25,52.5%25,4.3%25);fill-opacity:1;">
<use xlink:href="%23glyph-9999811-1" x="706.578" y="218.333333"/>
<use xlink:href="%23glyph-9999811-7" x="707.738" y="218.333333"/>
<use xlink:href="%23glyph-9999811-2" x="708.898" y="218.333333"/>
</g>
<g style="fill:rgb(72.2%25,52.5%25,4.3%25);fill-opacity:1;">
<use xlink:href="%23glyph-9999811-1" x="716.578" y="218.333333"/>
<use xlink:href="%23glyph-9999811-8" x="717.738" y="218.333333"/>
<use xlink:href="%23glyph-9999811-2" x="718.898" y="218.333333"/>
</g>
<g style="fill:rgb(72.2%25,52.5%25,4.3%25);fill-opacity:1;">
<use xlink:href="%23glyph-9999811-1" x="726.578" y="218.333333"/>
<use xlink:href="%23glyph-9999811-9" x="727.738" y="218.333333"/>
<use xlink:href="%23glyph-9999811-2" x="728.898" y="218.333333"/>
</g>
<g style="fill:rgb(72.2%25,52.5%25,4.3%25);fill-opacity:1;">
<use xlink:href="%23glyph-9999811-1" x="736.578" y="218.333333"/>
<use xlink:href="%23glyph-9999811-10" x="737.738" y="218.333333"/>
<use xlink:href="%23glyph-9999811-2" x="738.898" y="218.333333"/>
</g>
<g style="fill:rgb(72.2%25,52.5%25,4.3%25);fill-opacity:1;">
<use xlink:href="%23glyph-9999811-3" x="746.578" y="218.333333"/>
<use xlink:href="%23glyph-9999811-2" x="747.738" y="218.333333"/>
<use xlink:href="%23glyph-9999811-2" x="748.898" y="218.333333"/>
</g>
<g style="fill:rgb(72.2%25,52.5%25,4.3%25);fill-opacity:1;">
<use xlink:href="%23glyph-9999812-1" x="543.333333" y="232.738"/>
<use xlink:href="%23glyph-9999812-2" x="543.333333" y="233.898"/>
</g>
<g style="fill:rgb(72.2%25,52.5%25,4.3%25);fill-opacity:1;">
<use xlink:href="%23glyph-9999812-3" x="543.333333" y="242.738"/>
<use xlink:href="%23glyph-9999812-2" x="543.333333" y="243.898"/>
</g>
<g style="fill:rgb(72.2%25,52.5%25,4.3%25);fill-opacity:1;">
<use xlink:href="%23glyph-9999812-4" x="543.333333" y="252.738"/>
<use xlink:href="%23glyph-9999812-2" x="543.333333" y="253.898"/>
</g>
<g style="fill:rgb(72.2%25,52.5%25,4.3%25);fill-opacity:1;">
<use xlink:href="%23glyph-9999812-5" x="543.333333" y="262.738"/>
<use xlink:href="%23glyph-9999812-2" x="543.333333" y="263.898"/>
</g>
<g style="fill:rgb(72.2%25,52.5%25,4.3%25);fill-opacity:1;">
<use xlink:href="%23glyph-9999812-6" x="543.333333" y="272.738"/>
<use xlink:href="%23glyph-9999812-2" x="543.333333" y="273.898"/>
</g>
<g style="fill:rgb(72.2%25,52.5%25,4.3%25);fill-opacity:1;">
<use xlink:href="%23glyph-9999812-7" x="543.333333" y="282.738"/>
<use xlink:href="%23glyph-9999812-2" x="543.333333" y="283.898"/>
</g>
<g style="fill:rgb(72.2%25,52.5%25,4.3%25);fill-opacity:1;">
<use xlink:href="%23glyph-9999812-8" x="543.333333" y="292.738"/>
<use xlink:href="%23glyph-9999812-2" x="543.333333" y="293.898"/>
</g>
<g style="fill:rgb(72.2%25,52.5%25,4.3%25);fill-opacity:1;">
<use xlink:href="%23glyph-9999812-9" x="543.333333" y="302.738"/>
<use xlink:href="%23glyph-9999812-2" x="543.333333" y="303.898"/>
</g>
<g style="fill:rgb(72.2%25,52.5%25,4.3%25);fill-opacity:1;">
<use xlink:href="%23glyph-9999812-10" x="543.333333" y="312.738"/>
<use xlink:href="%23glyph-9999812-2" x="543.333333" y="313.898"/>
</g>
<g style="fill:rgb(72.2%25,52.5%25,4.3%25);fill-opacity:1;">
<use xlink:href="%23glyph-9999812-1" x="543.333333" y="321.578"/>
<use xlink:href="%23glyph-9999812-2" x="543.333333" y="322.738"/>
<use xlink:href="%23glyph-9999812-2" x="543.333333" y="323.898"/>
</g>
<g style="fill:rgb(72.2%25,52.5%25,4.3%25);fill-opacity:1;">
<use xlink:href="%23glyph-9999812-1" x="543.333333" y="331.578"/>
<use xlink:href="%23glyph-9999812-1" x="543.333333" y="332.738"/>
<use xlink:href="%23glyph-9999812-2" x="543.333333" y="333.898"/>
</g>
<g style="fill:rgb(72.2%25,52.5%25,4.3%25);fill-opacity:1;">
<use xlink:href="%23glyph-9999812-1" x="543.333333" y="341.578"/>
<use xlink:href="%23glyph-9999812-3" x="543.333333" y="342.738"/>
<use xlink:href="%23glyph-9999812-2" x="543.333333" y="343.898"/>
</g>
<g style="fill:rgb(72.2%25,52.5%25,4.3%25);fill-opacity:1;">
<use xlink:href="%23glyph-9999812-1" x="543.333333" y="351.578"/>
<use xlink:href="%23glyph-9999812-4" x="543.333333" y="352.738"/>
<use xlink:href="%23glyph-9999812-2" x="543.333333" y="353.898"/>
</g>
<g style="fill:rgb(72.2%25,52.5%25,4.3%25);fill-opacity:1;">
<use xlink:href="%23glyph-9999812-1" x="543.333333" y="361.578"/>
<use xlink:href="%23glyph-9999812-5" x="543.333333" y="362.738"/>
<use xlink:href="%23glyph-9999812-2" x="543.333333" y="363.898"/>
</g>
<g style="fill:rgb(72.2%25,52.5%25,4.3%25);fill-opacity:1;">
<use xlink:href="%23glyph-9999812-1" x="543.333333" y="371.578"/>
<use xlink:href="%23glyph-9999812-6" x="543.333333" y="372.738"/>
<use xlink:href="%23glyph-9999812-2" x="543.333333" y="373.898"/>
</g>
<g style="fill:rgb(72.2%25,52.5%25,4.3%25);fill-opacity:1;">
<use xlink:href="%23glyph-9999812-1" x="543.333333" y="381.578"/>
<use xlink:href="%23glyph-9999812-7" x="543.333333" y="382.738"/>
<use xlink:href="%23glyph-9999812-2" x="543.333333" y="383.898"/>
</g>
<g style="fill:rgb(72.2%25,52.5%25,4.3%25);fill-opacity:1;">
<use xlink:href="%23glyph-9999812-1" x="543.333333" y="391.578"/>
<use xlink:href="%23glyph-9999812-8" x="543.333333" y="392.738"/>
<use xlink:href="%23glyph-9999812-2" x="543.333333" y="393.898"/>
</g>
<g style="fill:rgb(72.2%25,52.5%25,4.3%25);fill-opacity:1;">
<use xlink:href="%23glyph-9999812-1" x="543.333333" y="401.578"/>
<use xlink:href="%23glyph-9999812-9" x="543.333333" y="402.738"/>
<use xlink:href="%23glyph-9999812-2" x="543.333333" y="403.898"/>
</g>
<g style="fill:rgb(72.2%25,52.5%25,4.3%25);fill-opacity:1;">
<use xlink:href="%23glyph-9999812-1" x="543.333333" y="411.578"/>
<use xlink:href="%23glyph-9999812-10" x="543.333333" y="412.738"/>
<use xlink:href="%23glyph-9999812-2" x="543.333333" y="413.898"/>
</g>
<g style="fill:rgb(72.2%25,52.5%25,4.3%25);fill-opacity:1;">
<use xlink:href="%23glyph-9999812-3" x="543.333333" y="421.578"/>
<use xlink:href="%23glyph-9999812-2" x="543.333333" y="422.738"/>
<use xlink:href="%23glyph-9999812-2" x="543.333333" y="423.898"/>
</g>
<g style="fill:rgb(72.2%25,52.5%25,4.3%25);fill-opacity:1;">
<use xlink:href="%23glyph-9999813-1" x="730.355" y="250.38125"/>
</g>
<g style="fill:rgb(72.2%25,52.5%25,4.3%25);fill-opacity:1;">
<use xlink:href="%23glyph-9999814-1" x="514.61875" y="395.5725"/>
</g>
<g style="fill:rgb(100%25,100%25,100%25);fill-opacity:1;">
<use xlink:href="%23glyph-9999813-1" x="560.355" y="220.38125"/>
</g>
<g style="fill:rgb(100%25,100%25,100%25);fill-opacity:1;">
<use xlink:href="%23glyph-9999814-1" x="537.952083" y="222.239167"/>
</g>
<path style="fill:none;stroke-width:0.25;stroke-linecap:butt;stroke-linejoin:miter;stroke:rgb(100%25,100%25,100%25);stroke-opacity:1;stroke-miterlimit:10;" d="M 552 225 C 552 226.105469 551.105469 227 550 227 C 548.894531 227 548 226.105469 548 225 C 548 223.894531 548.894531 223 550 223 C 551.105469 223 552 223.894531 552 225 Z M 552 225 "/>
<path style=" stroke:none;fill-rule:nonzero;fill:rgb(100%25,100%25,100%25);fill-opacity:0.5;" d="M 552 225 C 552 226.105469 551.105469 227 550 227 C 548.894531 227 548 226.105469 548 225 C 548 223.894531 548.894531 223 550 223 C 551.105469 223 552 223.894531 552 225 Z M 552 225 "/>
</g>
</svg>)
You could use a transformation matrix to reflect the Luxor drawing space in the x axis.
    pts = (Point(0, 0), Point(50, 100))
    @layer begin
        translate(table[1])
        arrow(pts...)
        rulers()
    end

    @layer begin
        translate(table[2])
        transform([1 0 0 -1 0 0])               # <--
        arrow(pts...)
        rulers()
end;fill-opacity:1;stroke:none;"/>
<path style="fill:none;stroke-width:1;stroke-linecap:butt;stroke-linejoin:miter;stroke:rgb(0%25,0%25,0%25);stroke-opacity:1;stroke-miterlimit:10;" d="M 250 225 L 295.867188 316.738281 "/>
<path style=" stroke:none;fill-rule:nonzero;fill:rgb(0%25,0%25,0%25);fill-opacity:1;" d="M 299.292969 315.023438 L 300 325 L 292.445312 318.449219 "/>
<path style="fill-rule:nonzero;fill:rgb(100%25,54.9%25,0%25);fill-opacity:0.5;stroke-width:0.25;stroke-linecap:butt;stroke-linejoin:miter;stroke:rgb(100%25,54.9%25,0%25);stroke-opacity:0.5;stroke-miterlimit:10;" d="M 250 225 L 250 205 L 450 205 L 450 225 Z M 250 225 "/>
<path style="fill-rule:nonzero;fill:rgb(100%25,54.9%25,0%25);fill-opacity:0.5;stroke-width:0.25;stroke-linecap:butt;stroke-linejoin:miter;stroke:rgb(100%25,54.9%25,0%25);stroke-opacity:0.5;stroke-miterlimit:10;" d="M 230 425 L 230 225 L 250 225 L 250 425 Z M 230 425 "/>
<path style="fill:none;stroke-width:0.25;stroke-linecap:butt;stroke-linejoin:miter;stroke:rgb(72.2%25,52.5%25,4.3%25);stroke-opacity:1;stroke-miterlimit:10;" d="M 250 225 L 250 220 "/>
<path style="fill:none;stroke-width:0.25;stroke-linecap:butt;stroke-linejoin:miter;stroke:rgb(72.2%25,52.5%25,4.3%25);stroke-opacity:1;stroke-miterlimit:10;" d="M 260 225 L 260 220 "/>
<path style="fill:none;stroke-width:0.25;stroke-linecap:butt;stroke-linejoin:miter;stroke:rgb(72.2%25,52.5%25,4.3%25);stroke-opacity:1;stroke-miterlimit:10;" d="M 270 225 L 270 220 "/>
<path style="fill:none;stroke-width:0.25;stroke-linecap:butt;stroke-linejoin:miter;stroke:rgb(72.2%25,52.5%25,4.3%25);stroke-opacity:1;stroke-miterlimit:10;" d="M 280 225 L 280 220 "/>
<path style="fill:none;stroke-width:0.25;stroke-linecap:butt;stroke-linejoin:miter;stroke:rgb(72.2%25,52.5%25,4.3%25);stroke-opacity:1;stroke-miterlimit:10;" d="M 290 225 L 290 220 "/>
<path style="fill:none;stroke-width:0.25;stroke-linecap:butt;stroke-linejoin:miter;stroke:rgb(72.2%25,52.5%25,4.3%25);stroke-opacity:1;stroke-miterlimit:10;" d="M 300 225 L 300 220 "/>
<path style="fill:none;stroke-width:0.25;stroke-linecap:butt;stroke-linejoin:miter;stroke:rgb(72.2%25,52.5%25,4.3%25);stroke-opacity:1;stroke-miterlimit:10;" d="M 310 225 L 310 220 "/>
<path style="fill:none;stroke-width:0.25;stroke-linecap:butt;stroke-linejoin:miter;stroke:rgb(72.2%25,52.5%25,4.3%25);stroke-opacity:1;stroke-miterlimit:10;" d="M 320 225 L 320 220 "/>
<path style="fill:none;stroke-width:0.25;stroke-linecap:butt;stroke-linejoin:miter;stroke:rgb(72.2%25,52.5%25,4.3%25);stroke-opacity:1;stroke-miterlimit:10;" d="M 330 225 L 330 220 "/>
<path style="fill:none;stroke-width:0.25;stroke-linecap:butt;stroke-linejoin:miter;stroke:rgb(72.2%25,52.5%25,4.3%25);stroke-opacity:1;stroke-miterlimit:10;" d="M 340 225 L 340 220 "/>
<path style="fill:none;stroke-width:0.25;stroke-linecap:butt;stroke-linejoin:miter;stroke:rgb(72.2%25,52.5%25,4.3%25);stroke-opacity:1;stroke-miterlimit:10;" d="M 350 225 L 350 220 "/>
<path style="fill:none;stroke-width:0.25;stroke-linecap:butt;stroke-linejoin:miter;stroke:rgb(72.2%25,52.5%25,4.3%25);stroke-opacity:1;stroke-miterlimit:10;" d="M 360 225 L 360 220 "/>
<path style="fill:none;stroke-width:0.25;stroke-linecap:butt;stroke-linejoin:miter;stroke:rgb(72.2%25,52.5%25,4.3%25);stroke-opacity:1;stroke-miterlimit:10;" d="M 370 225 L 370 220 "/>
<path style="fill:none;stroke-width:0.25;stroke-linecap:butt;stroke-linejoin:miter;stroke:rgb(72.2%25,52.5%25,4.3%25);stroke-opacity:1;stroke-miterlimit:10;" d="M 380 225 L 380 220 "/>
<path style="fill:none;stroke-width:0.25;stroke-linecap:butt;stroke-linejoin:miter;stroke:rgb(72.2%25,52.5%25,4.3%25);stroke-opacity:1;stroke-miterlimit:10;" d="M 390 225 L 390 220 "/>
<path style="fill:none;stroke-width:0.25;stroke-linecap:butt;stroke-linejoin:miter;stroke:rgb(72.2%25,52.5%25,4.3%25);stroke-opacity:1;stroke-miterlimit:10;" d="M 400 225 L 400 220 "/>
<path style="fill:none;stroke-width:0.25;stroke-linecap:butt;stroke-linejoin:miter;stroke:rgb(72.2%25,52.5%25,4.3%25);stroke-opacity:1;stroke-miterlimit:10;" d="M 410 225 L 410 220 "/>
<path style="fill:none;stroke-width:0.25;stroke-linecap:butt;stroke-linejoin:miter;stroke:rgb(72.2%25,52.5%25,4.3%25);stroke-opacity:1;stroke-miterlimit:10;" d="M 420 225 L 420 220 "/>
<path style="fill:none;stroke-width:0.25;stroke-linecap:butt;stroke-linejoin:miter;stroke:rgb(72.2%25,52.5%25,4.3%25);stroke-opacity:1;stroke-miterlimit:10;" d="M 430 225 L 430 220 "/>
<path style="fill:none;stroke-width:0.25;stroke-linecap:butt;stroke-linejoin:miter;stroke:rgb(72.2%25,52.5%25,4.3%25);stroke-opacity:1;stroke-miterlimit:10;" d="M 440 225 L 440 220 "/>
<path style="fill:none;stroke-width:0.25;stroke-linecap:butt;stroke-linejoin:miter;stroke:rgb(72.2%25,52.5%25,4.3%25);stroke-opacity:1;stroke-miterlimit:10;" d="M 450 225 L 450 220 "/>
<path style="fill:none;stroke-width:0.25;stroke-linecap:butt;stroke-linejoin:miter;stroke:rgb(72.2%25,52.5%25,4.3%25);stroke-opacity:1;stroke-miterlimit:10;" d="M 245 225 L 250 225 "/>
<path style="fill:none;stroke-width:0.25;stroke-linecap:butt;stroke-linejoin:miter;stroke:rgb(72.2%25,52.5%25,4.3%25);stroke-opacity:1;stroke-miterlimit:10;" d="M 245 235 L 250 235 "/>
<path style="fill:none;stroke-width:0.25;stroke-linecap:butt;stroke-linejoin:miter;stroke:rgb(72.2%25,52.5%25,4.3%25);stroke-opacity:1;stroke-miterlimit:10;" d="M 245 245 L 250 245 "/>
<path style="fill:none;stroke-width:0.25;stroke-linecap:butt;stroke-linejoin:miter;stroke:rgb(72.2%25,52.5%25,4.3%25);stroke-opacity:1;stroke-miterlimit:10;" d="M 245 255 L 250 255 "/>
<path style="fill:none;stroke-width:0.25;stroke-linecap:butt;stroke-linejoin:miter;stroke:rgb(72.2%25,52.5%25,4.3%25);stroke-opacity:1;stroke-miterlimit:10;" d="M 245 265 L 250 265 "/>
<path style="fill:none;stroke-width:0.25;stroke-linecap:butt;stroke-linejoin:miter;stroke:rgb(72.2%25,52.5%25,4.3%25);stroke-opacity:1;stroke-miterlimit:10;" d="M 245 275 L 250 275 "/>
<path style="fill:none;stroke-width:0.25;stroke-linecap:butt;stroke-linejoin:miter;stroke:rgb(72.2%25,52.5%25,4.3%25);stroke-opacity:1;stroke-miterlimit:10;" d="M 245 285 L 250 285 "/>
<path style="fill:none;stroke-width:0.25;stroke-linecap:butt;stroke-linejoin:miter;stroke:rgb(72.2%25,52.5%25,4.3%25);stroke-opacity:1;stroke-miterlimit:10;" d="M 245 295 L 250 295 "/>
<path style="fill:none;stroke-width:0.25;stroke-linecap:butt;stroke-linejoin:miter;stroke:rgb(72.2%25,52.5%25,4.3%25);stroke-opacity:1;stroke-miterlimit:10;" d="M 245 305 L 250 305 "/>
<path style="fill:none;stroke-width:0.25;stroke-linecap:butt;stroke-linejoin:miter;stroke:rgb(72.2%25,52.5%25,4.3%25);stroke-opacity:1;stroke-miterlimit:10;" d="M 245 315 L 250 315 "/>
<path style="fill:none;stroke-width:0.25;stroke-linecap:butt;stroke-linejoin:miter;stroke:rgb(72.2%25,52.5%25,4.3%25);stroke-opacity:1;stroke-miterlimit:10;" d="M 245 325 L 250 325 "/>
<path style="fill:none;stroke-width:0.25;stroke-linecap:butt;stroke-linejoin:miter;stroke:rgb(72.2%25,52.5%25,4.3%25);stroke-opacity:1;stroke-miterlimit:10;" d="M 245 335 L 250 335 "/>
<path style="fill:none;stroke-width:0.25;stroke-linecap:butt;stroke-linejoin:miter;stroke:rgb(72.2%25,52.5%25,4.3%25);stroke-opacity:1;stroke-miterlimit:10;" d="M 245 345 L 250 345 "/>
<path style="fill:none;stroke-width:0.25;stroke-linecap:butt;stroke-linejoin:miter;stroke:rgb(72.2%25,52.5%25,4.3%25);stroke-opacity:1;stroke-miterlimit:10;" d="M 245 355 L 250 355 "/>
<path style="fill:none;stroke-width:0.25;stroke-linecap:butt;stroke-linejoin:miter;stroke:rgb(72.2%25,52.5%25,4.3%25);stroke-opacity:1;stroke-miterlimit:10;" d="M 245 365 L 250 365 "/>
<path style="fill:none;stroke-width:0.25;stroke-linecap:butt;stroke-linejoin:miter;stroke:rgb(72.2%25,52.5%25,4.3%25);stroke-opacity:1;stroke-miterlimit:10;" d="M 245 375 L 250 375 "/>
<path style="fill:none;stroke-width:0.25;stroke-linecap:butt;stroke-linejoin:miter;stroke:rgb(72.2%25,52.5%25,4.3%25);stroke-opacity:1;stroke-miterlimit:10;" d="M 245 385 L 250 385 "/>
<path style="fill:none;stroke-width:0.25;stroke-linecap:butt;stroke-linejoin:miter;stroke:rgb(72.2%25,52.5%25,4.3%25);stroke-opacity:1;stroke-miterlimit:10;" d="M 245 395 L 250 395 "/>
<path style="fill:none;stroke-width:0.25;stroke-linecap:butt;stroke-linejoin:miter;stroke:rgb(72.2%25,52.5%25,4.3%25);stroke-opacity:1;stroke-miterlimit:10;" d="M 245 405 L 250 405 "/>
<path style="fill:none;stroke-width:0.25;stroke-linecap:butt;stroke-linejoin:miter;stroke:rgb(72.2%25,52.5%25,4.3%25);stroke-opacity:1;stroke-miterlimit:10;" d="M 245 415 L 250 415 "/>
<path style="fill:none;stroke-width:0.25;stroke-linecap:butt;stroke-linejoin:miter;stroke:rgb(72.2%25,52.5%25,4.3%25);stroke-opacity:1;stroke-miterlimit:10;" d="M 245 425 L 250 425 "/>
<path style="fill:none;stroke-width:0.25;stroke-linecap:butt;stroke-linejoin:miter;stroke:rgb(72.2%25,52.5%25,4.3%25);stroke-opacity:1;stroke-miterlimit:10;" d="M 250 225 L 250 221.667969 "/>
<path style="fill:none;stroke-width:0.25;stroke-linecap:butt;stroke-linejoin:miter;stroke:rgb(72.2%25,52.5%25,4.3%25);stroke-opacity:1;stroke-miterlimit:10;" d="M 255 225 L 255 221.667969 "/>
<path style="fill:none;stroke-width:0.25;stroke-linecap:butt;stroke-linejoin:miter;stroke:rgb(72.2%25,52.5%25,4.3%25);stroke-opacity:1;stroke-miterlimit:10;" d="M 260 225 L 260 221.667969 "/>
<path style="fill:none;stroke-width:0.25;stroke-linecap:butt;stroke-linejoin:miter;stroke:rgb(72.2%25,52.5%25,4.3%25);stroke-opacity:1;stroke-miterlimit:10;" d="M 265 225 L 265 221.667969 "/>
<path style="fill:none;stroke-width:0.25;stroke-linecap:butt;stroke-linejoin:miter;stroke:rgb(72.2%25,52.5%25,4.3%25);stroke-opacity:1;stroke-miterlimit:10;" d="M 270 225 L 270 221.667969 "/>
<path style="fill:none;stroke-width:0.25;stroke-linecap:butt;stroke-linejoin:miter;stroke:rgb(72.2%25,52.5%25,4.3%25);stroke-opacity:1;stroke-miterlimit:10;" d="M 275 225 L 275 221.667969 "/>
<path style="fill:none;stroke-width:0.25;stroke-linecap:butt;stroke-linejoin:miter;stroke:rgb(72.2%25,52.5%25,4.3%25);stroke-opacity:1;stroke-miterlimit:10;" d="M 280 225 L 280 221.667969 "/>
<path style="fill:none;stroke-width:0.25;stroke-linecap:butt;stroke-linejoin:miter;stroke:rgb(72.2%25,52.5%25,4.3%25);stroke-opacity:1;stroke-miterlimit:10;" d="M 285 225 L 285 221.667969 "/>
<path style="fill:none;stroke-width:0.25;stroke-linecap:butt;stroke-linejoin:miter;stroke:rgb(72.2%25,52.5%25,4.3%25);stroke-opacity:1;stroke-miterlimit:10;" d="M 290 225 L 290 221.667969 "/>
<path style="fill:none;stroke-width:0.25;stroke-linecap:butt;stroke-linejoin:miter;stroke:rgb(72.2%25,52.5%25,4.3%25);stroke-opacity:1;stroke-miterlimit:10;" d="M 295 225 L 295 221.667969 "/>
<path style="fill:none;stroke-width:0.25;stroke-linecap:butt;stroke-linejoin:miter;stroke:rgb(72.2%25,52.5%25,4.3%25);stroke-opacity:1;stroke-miterlimit:10;" d="M 300 225 L 300 221.667969 "/>
<path style="fill:none;stroke-width:0.25;stroke-linecap:butt;stroke-linejoin:miter;stroke:rgb(72.2%25,52.5%25,4.3%25);stroke-opacity:1;stroke-miterlimit:10;" d="M 305 225 L 305 221.667969 "/>
<path style="fill:none;stroke-width:0.25;stroke-linecap:butt;stroke-linejoin:miter;stroke:rgb(72.2%25,52.5%25,4.3%25);stroke-opacity:1;stroke-miterlimit:10;" d="M 310 225 L 310 221.667969 "/>
<path style="fill:none;stroke-width:0.25;stroke-linecap:butt;stroke-linejoin:miter;stroke:rgb(72.2%25,52.5%25,4.3%25);stroke-opacity:1;stroke-miterlimit:10;" d="M 315 225 L 315 221.667969 "/>
<path style="fill:none;stroke-width:0.25;stroke-linecap:butt;stroke-linejoin:miter;stroke:rgb(72.2%25,52.5%25,4.3%25);stroke-opacity:1;stroke-miterlimit:10;" d="M 320 225 L 320 221.667969 "/>
<path style="fill:none;stroke-width:0.25;stroke-linecap:butt;stroke-linejoin:miter;stroke:rgb(72.2%25,52.5%25,4.3%25);stroke-opacity:1;stroke-miterlimit:10;" d="M 325 225 L 325 221.667969 "/>
<path style="fill:none;stroke-width:0.25;stroke-linecap:butt;stroke-linejoin:miter;stroke:rgb(72.2%25,52.5%25,4.3%25);stroke-opacity:1;stroke-miterlimit:10;" d="M 330 225 L 330 221.667969 "/>
<path style="fill:none;stroke-width:0.25;stroke-linecap:butt;stroke-linejoin:miter;stroke:rgb(72.2%25,52.5%25,4.3%25);stroke-opacity:1;stroke-miterlimit:10;" d="M 335 225 L 335 221.667969 "/>
<path style="fill:none;stroke-width:0.25;stroke-linecap:butt;stroke-linejoin:miter;stroke:rgb(72.2%25,52.5%25,4.3%25);stroke-opacity:1;stroke-miterlimit:10;" d="M 340 225 L 340 221.667969 "/>
<path style="fill:none;stroke-width:0.25;stroke-linecap:butt;stroke-linejoin:miter;stroke:rgb(72.2%25,52.5%25,4.3%25);stroke-opacity:1;stroke-miterlimit:10;" d="M 345 225 L 345 221.667969 "/>
<path style="fill:none;stroke-width:0.25;stroke-linecap:butt;stroke-linejoin:miter;stroke:rgb(72.2%25,52.5%25,4.3%25);stroke-opacity:1;stroke-miterlimit:10;" d="M 350 225 L 350 221.667969 "/>
<path style="fill:none;stroke-width:0.25;stroke-linecap:butt;stroke-linejoin:miter;stroke:rgb(72.2%25,52.5%25,4.3%25);stroke-opacity:1;stroke-miterlimit:10;" d="M 355 225 L 355 221.667969 "/>
<path style="fill:none;stroke-width:0.25;stroke-linecap:butt;stroke-linejoin:miter;stroke:rgb(72.2%25,52.5%25,4.3%25);stroke-opacity:1;stroke-miterlimit:10;" d="M 360 225 L 360 221.667969 "/>
<path style="fill:none;stroke-width:0.25;stroke-linecap:butt;stroke-linejoin:miter;stroke:rgb(72.2%25,52.5%25,4.3%25);stroke-opacity:1;stroke-miterlimit:10;" d="M 365 225 L 365 221.667969 "/>
<path style="fill:none;stroke-width:0.25;stroke-linecap:butt;stroke-linejoin:miter;stroke:rgb(72.2%25,52.5%25,4.3%25);stroke-opacity:1;stroke-miterlimit:10;" d="M 370 225 L 370 221.667969 "/>
<path style="fill:none;stroke-width:0.25;stroke-linecap:butt;stroke-linejoin:miter;stroke:rgb(72.2%25,52.5%25,4.3%25);stroke-opacity:1;stroke-miterlimit:10;" d="M 375 225 L 375 221.667969 "/>
<path style="fill:none;stroke-width:0.25;stroke-linecap:butt;stroke-linejoin:miter;stroke:rgb(72.2%25,52.5%25,4.3%25);stroke-opacity:1;stroke-miterlimit:10;" d="M 380 225 L 380 221.667969 "/>
<path style="fill:none;stroke-width:0.25;stroke-linecap:butt;stroke-linejoin:miter;stroke:rgb(72.2%25,52.5%25,4.3%25);stroke-opacity:1;stroke-miterlimit:10;" d="M 385 225 L 385 221.667969 "/>
<path style="fill:none;stroke-width:0.25;stroke-linecap:butt;stroke-linejoin:miter;stroke:rgb(72.2%25,52.5%25,4.3%25);stroke-opacity:1;stroke-miterlimit:10;" d="M 390 225 L 390 221.667969 "/>
<path style="fill:none;stroke-width:0.25;stroke-linecap:butt;stroke-linejoin:miter;stroke:rgb(72.2%25,52.5%25,4.3%25);stroke-opacity:1;stroke-miterlimit:10;" d="M 395 225 L 395 221.667969 "/>
<path style="fill:none;stroke-width:0.25;stroke-linecap:butt;stroke-linejoin:miter;stroke:rgb(72.2%25,52.5%25,4.3%25);stroke-opacity:1;stroke-miterlimit:10;" d="M 400 225 L 400 221.667969 "/>
<path style="fill:none;stroke-width:0.25;stroke-linecap:butt;stroke-linejoin:miter;stroke:rgb(72.2%25,52.5%25,4.3%25);stroke-opacity:1;stroke-miterlimit:10;" d="M 405 225 L 405 221.667969 "/>
<path style="fill:none;stroke-width:0.25;stroke-linecap:butt;stroke-linejoin:miter;stroke:rgb(72.2%25,52.5%25,4.3%25);stroke-opacity:1;stroke-miterlimit:10;" d="M 410 225 L 410 221.667969 "/>
<path style="fill:none;stroke-width:0.25;stroke-linecap:butt;stroke-linejoin:miter;stroke:rgb(72.2%25,52.5%25,4.3%25);stroke-opacity:1;stroke-miterlimit:10;" d="M 415 225 L 415 221.667969 "/>
<path style="fill:none;stroke-width:0.25;stroke-linecap:butt;stroke-linejoin:miter;stroke:rgb(72.2%25,52.5%25,4.3%25);stroke-opacity:1;stroke-miterlimit:10;" d="M 420 225 L 420 221.667969 "/>
<path style="fill:none;stroke-width:0.25;stroke-linecap:butt;stroke-linejoin:miter;stroke:rgb(72.2%25,52.5%25,4.3%25);stroke-opacity:1;stroke-miterlimit:10;" d="M 425 225 L 425 221.667969 "/>
<path style="fill:none;stroke-width:0.25;stroke-linecap:butt;stroke-linejoin:miter;stroke:rgb(72.2%25,52.5%25,4.3%25);stroke-opacity:1;stroke-miterlimit:10;" d="M 430 225 L 430 221.667969 "/>
<path style="fill:none;stroke-width:0.25;stroke-linecap:butt;stroke-linejoin:miter;stroke:rgb(72.2%25,52.5%25,4.3%25);stroke-opacity:1;stroke-miterlimit:10;" d="M 435 225 L 435 221.667969 "/>
<path style="fill:none;stroke-width:0.25;stroke-linecap:butt;stroke-linejoin:miter;stroke:rgb(72.2%25,52.5%25,4.3%25);stroke-opacity:1;stroke-miterlimit:10;" d="M 440 225 L 440 221.667969 "/>
<path style="fill:none;stroke-width:0.25;stroke-linecap:butt;stroke-linejoin:miter;stroke:rgb(72.2%25,52.5%25,4.3%25);stroke-opacity:1;stroke-miterlimit:10;" d="M 445 225 L 445 221.667969 "/>
<path style="fill:none;stroke-width:0.25;stroke-linecap:butt;stroke-linejoin:miter;stroke:rgb(72.2%25,52.5%25,4.3%25);stroke-opacity:1;stroke-miterlimit:10;" d="M 450 225 L 450 221.667969 "/>
<path style="fill:none;stroke-width:0.25;stroke-linecap:butt;stroke-linejoin:miter;stroke:rgb(72.2%25,52.5%25,4.3%25);stroke-opacity:1;stroke-miterlimit:10;" d="M 246.667969 225 L 250 225 "/>
<path style="fill:none;stroke-width:0.25;stroke-linecap:butt;stroke-linejoin:miter;stroke:rgb(72.2%25,52.5%25,4.3%25);stroke-opacity:1;stroke-miterlimit:10;" d="M 246.667969 230 L 250 230 "/>
<path style="fill:none;stroke-width:0.25;stroke-linecap:butt;stroke-linejoin:miter;stroke:rgb(72.2%25,52.5%25,4.3%25);stroke-opacity:1;stroke-miterlimit:10;" d="M 246.667969 235 L 250 235 "/>
<path style="fill:none;stroke-width:0.25;stroke-linecap:butt;stroke-linejoin:miter;stroke:rgb(72.2%25,52.5%25,4.3%25);stroke-opacity:1;stroke-miterlimit:10;" d="M 246.667969 240 L 250 240 "/>
<path style="fill:none;stroke-width:0.25;stroke-linecap:butt;stroke-linejoin:miter;stroke:rgb(72.2%25,52.5%25,4.3%25);stroke-opacity:1;stroke-miterlimit:10;" d="M 246.667969 245 L 250 245 "/>
<path style="fill:none;stroke-width:0.25;stroke-linecap:butt;stroke-linejoin:miter;stroke:rgb(72.2%25,52.5%25,4.3%25);stroke-opacity:1;stroke-miterlimit:10;" d="M 246.667969 250 L 250 250 "/>
<path style="fill:none;stroke-width:0.25;stroke-linecap:butt;stroke-linejoin:miter;stroke:rgb(72.2%25,52.5%25,4.3%25);stroke-opacity:1;stroke-miterlimit:10;" d="M 246.667969 255 L 250 255 "/>
<path style="fill:none;stroke-width:0.25;stroke-linecap:butt;stroke-linejoin:miter;stroke:rgb(72.2%25,52.5%25,4.3%25);stroke-opacity:1;stroke-miterlimit:10;" d="M 246.667969 260 L 250 260 "/>
<path style="fill:none;stroke-width:0.25;stroke-linecap:butt;stroke-linejoin:miter;stroke:rgb(72.2%25,52.5%25,4.3%25);stroke-opacity:1;stroke-miterlimit:10;" d="M 246.667969 265 L 250 265 "/>
<path style="fill:none;stroke-width:0.25;stroke-linecap:butt;stroke-linejoin:miter;stroke:rgb(72.2%25,52.5%25,4.3%25);stroke-opacity:1;stroke-miterlimit:10;" d="M 246.667969 270 L 250 270 "/>
<path style="fill:none;stroke-width:0.25;stroke-linecap:butt;stroke-linejoin:miter;stroke:rgb(72.2%25,52.5%25,4.3%25);stroke-opacity:1;stroke-miterlimit:10;" d="M 246.667969 275 L 250 275 "/>
<path style="fill:none;stroke-width:0.25;stroke-linecap:butt;stroke-linejoin:miter;stroke:rgb(72.2%25,52.5%25,4.3%25);stroke-opacity:1;stroke-miterlimit:10;" d="M 246.667969 280 L 250 280 "/>
<path style="fill:none;stroke-width:0.25;stroke-linecap:butt;stroke-linejoin:miter;stroke:rgb(72.2%25,52.5%25,4.3%25);stroke-opacity:1;stroke-miterlimit:10;" d="M 246.667969 285 L 250 285 "/>
<path style="fill:none;stroke-width:0.25;stroke-linecap:butt;stroke-linejoin:miter;stroke:rgb(72.2%25,52.5%25,4.3%25);stroke-opacity:1;stroke-miterlimit:10;" d="M 246.667969 290 L 250 290 "/>
<path style="fill:none;stroke-width:0.25;stroke-linecap:butt;stroke-linejoin:miter;stroke:rgb(72.2%25,52.5%25,4.3%25);stroke-opacity:1;stroke-miterlimit:10;" d="M 246.667969 295 L 250 295 "/>
<path style="fill:none;stroke-width:0.25;stroke-linecap:butt;stroke-linejoin:miter;stroke:rgb(72.2%25,52.5%25,4.3%25);stroke-opacity:1;stroke-miterlimit:10;" d="M 246.667969 300 L 250 300 "/>
<path style="fill:none;stroke-width:0.25;stroke-linecap:butt;stroke-linejoin:miter;stroke:rgb(72.2%25,52.5%25,4.3%25);stroke-opacity:1;stroke-miterlimit:10;" d="M 246.667969 305 L 250 305 "/>
<path style="fill:none;stroke-width:0.25;stroke-linecap:butt;stroke-linejoin:miter;stroke:rgb(72.2%25,52.5%25,4.3%25);stroke-opacity:1;stroke-miterlimit:10;" d="M 246.667969 310 L 250 310 "/>
<path style="fill:none;stroke-width:0.25;stroke-linecap:butt;stroke-linejoin:miter;stroke:rgb(72.2%25,52.5%25,4.3%25);stroke-opacity:1;stroke-miterlimit:10;" d="M 246.667969 315 L 250 315 "/>
<path style="fill:none;stroke-width:0.25;stroke-linecap:butt;stroke-linejoin:miter;stroke:rgb(72.2%25,52.5%25,4.3%25);stroke-opacity:1;stroke-miterlimit:10;" d="M 246.667969 320 L 250 320 "/>
<path style="fill:none;stroke-width:0.25;stroke-linecap:butt;stroke-linejoin:miter;stroke:rgb(72.2%25,52.5%25,4.3%25);stroke-opacity:1;stroke-miterlimit:10;" d="M 246.667969 325 L 250 325 "/>
<path style="fill:none;stroke-width:0.25;stroke-linecap:butt;stroke-linejoin:miter;stroke:rgb(72.2%25,52.5%25,4.3%25);stroke-opacity:1;stroke-miterlimit:10;" d="M 246.667969 330 L 250 330 "/>
<path style="fill:none;stroke-width:0.25;stroke-linecap:butt;stroke-linejoin:miter;stroke:rgb(72.2%25,52.5%25,4.3%25);stroke-opacity:1;stroke-miterlimit:10;" d="M 246.667969 335 L 250 335 "/>
<path style="fill:none;stroke-width:0.25;stroke-linecap:butt;stroke-linejoin:miter;stroke:rgb(72.2%25,52.5%25,4.3%25);stroke-opacity:1;stroke-miterlimit:10;" d="M 246.667969 340 L 250 340 "/>
<path style="fill:none;stroke-width:0.25;stroke-linecap:butt;stroke-linejoin:miter;stroke:rgb(72.2%25,52.5%25,4.3%25);stroke-opacity:1;stroke-miterlimit:10;" d="M 246.667969 345 L 250 345 "/>
<path style="fill:none;stroke-width:0.25;stroke-linecap:butt;stroke-linejoin:miter;stroke:rgb(72.2%25,52.5%25,4.3%25);stroke-opacity:1;stroke-miterlimit:10;" d="M 246.667969 350 L 250 350 "/>
<path style="fill:none;stroke-width:0.25;stroke-linecap:butt;stroke-linejoin:miter;stroke:rgb(72.2%25,52.5%25,4.3%25);stroke-opacity:1;stroke-miterlimit:10;" d="M 246.667969 355 L 250 355 "/>
<path style="fill:none;stroke-width:0.25;stroke-linecap:butt;stroke-linejoin:miter;stroke:rgb(72.2%25,52.5%25,4.3%25);stroke-opacity:1;stroke-miterlimit:10;" d="M 246.667969 360 L 250 360 "/>
<path style="fill:none;stroke-width:0.25;stroke-linecap:butt;stroke-linejoin:miter;stroke:rgb(72.2%25,52.5%25,4.3%25);stroke-opacity:1;stroke-miterlimit:10;" d="M 246.667969 365 L 250 365 "/>
<path style="fill:none;stroke-width:0.25;stroke-linecap:butt;stroke-linejoin:miter;stroke:rgb(72.2%25,52.5%25,4.3%25);stroke-opacity:1;stroke-miterlimit:10;" d="M 246.667969 370 L 250 370 "/>
<path style="fill:none;stroke-width:0.25;stroke-linecap:butt;stroke-linejoin:miter;stroke:rgb(72.2%25,52.5%25,4.3%25);stroke-opacity:1;stroke-miterlimit:10;" d="M 246.667969 375 L 250 375 "/>
<path style="fill:none;stroke-width:0.25;stroke-linecap:butt;stroke-linejoin:miter;stroke:rgb(72.2%25,52.5%25,4.3%25);stroke-opacity:1;stroke-miterlimit:10;" d="M 246.667969 380 L 250 380 "/>
<path style="fill:none;stroke-width:0.25;stroke-linecap:butt;stroke-linejoin:miter;stroke:rgb(72.2%25,52.5%25,4.3%25);stroke-opacity:1;stroke-miterlimit:10;" d="M 246.667969 385 L 250 385 "/>
<path style="fill:none;stroke-width:0.25;stroke-linecap:butt;stroke-linejoin:miter;stroke:rgb(72.2%25,52.5%25,4.3%25);stroke-opacity:1;stroke-miterlimit:10;" d="M 246.667969 390 L 250 390 "/>
<path style="fill:none;stroke-width:0.25;stroke-linecap:butt;stroke-linejoin:miter;stroke:rgb(72.2%25,52.5%25,4.3%25);stroke-opacity:1;stroke-miterlimit:10;" d="M 246.667969 395 L 250 395 "/>
<path style="fill:none;stroke-width:0.25;stroke-linecap:butt;stroke-linejoin:miter;stroke:rgb(72.2%25,52.5%25,4.3%25);stroke-opacity:1;stroke-miterlimit:10;" d="M 246.667969 400 L 250 400 "/>
<path style="fill:none;stroke-width:0.25;stroke-linecap:butt;stroke-linejoin:miter;stroke:rgb(72.2%25,52.5%25,4.3%25);stroke-opacity:1;stroke-miterlimit:10;" d="M 246.667969 405 L 250 405 "/>
<path style="fill:none;stroke-width:0.25;stroke-linecap:butt;stroke-linejoin:miter;stroke:rgb(72.2%25,52.5%25,4.3%25);stroke-opacity:1;stroke-miterlimit:10;" d="M 246.667969 410 L 250 410 "/>
<path style="fill:none;stroke-width:0.25;stroke-linecap:butt;stroke-linejoin:miter;stroke:rgb(72.2%25,52.5%25,4.3%25);stroke-opacity:1;stroke-miterlimit:10;" d="M 246.667969 415 L 250 415 "/>
<path style="fill:none;stroke-width:0.25;stroke-linecap:butt;stroke-linejoin:miter;stroke:rgb(72.2%25,52.5%25,4.3%25);stroke-opacity:1;stroke-miterlimit:10;" d="M 246.667969 420 L 250 420 "/>
<path style="fill:none;stroke-width:0.25;stroke-linecap:butt;stroke-linejoin:miter;stroke:rgb(72.2%25,52.5%25,4.3%25);stroke-opacity:1;stroke-miterlimit:10;" d="M 246.667969 425 L 250 425 "/>
<g style="fill:rgb(72.2%25,52.5%25,4.3%25);fill-opacity:1;">
<use xlink:href="%23glyph-1829020-1" x="257.738" y="218.333333"/>
<use xlink:href="%23glyph-1829020-2" x="258.898" y="218.333333"/>
</g>
<g style="fill:rgb(72.2%25,52.5%25,4.3%25);fill-opacity:1;">
<use xlink:href="%23glyph-1829020-3" x="267.738" y="218.333333"/>
<use xlink:href="%23glyph-1829020-2" x="268.898" y="218.333333"/>
</g>
<g style="fill:rgb(72.2%25,52.5%25,4.3%25);fill-opacity:1;">
<use xlink:href="%23glyph-1829020-4" x="277.738" y="218.333333"/>
<use xlink:href="%23glyph-1829020-2" x="278.898" y="218.333333"/>
</g>
<g style="fill:rgb(72.2%25,52.5%25,4.3%25);fill-opacity:1;">
<use xlink:href="%23glyph-1829020-5" x="287.738" y="218.333333"/>
<use xlink:href="%23glyph-1829020-2" x="288.898" y="218.333333"/>
</g>
<g style="fill:rgb(72.2%25,52.5%25,4.3%25);fill-opacity:1;">
<use xlink:href="%23glyph-1829020-6" x="297.738" y="218.333333"/>
<use xlink:href="%23glyph-1829020-2" x="298.898" y="218.333333"/>
</g>
<g style="fill:rgb(72.2%25,52.5%25,4.3%25);fill-opacity:1;">
<use xlink:href="%23glyph-1829020-7" x="307.738" y="218.333333"/>
<use xlink:href="%23glyph-1829020-2" x="308.898" y="218.333333"/>
</g>
<g style="fill:rgb(72.2%25,52.5%25,4.3%25);fill-opacity:1;">
<use xlink:href="%23glyph-1829020-8" x="317.738" y="218.333333"/>
<use xlink:href="%23glyph-1829020-2" x="318.898" y="218.333333"/>
</g>
<g style="fill:rgb(72.2%25,52.5%25,4.3%25);fill-opacity:1;">
<use xlink:href="%23glyph-1829020-9" x="327.738" y="218.333333"/>
<use xlink:href="%23glyph-1829020-2" x="328.898" y="218.333333"/>
</g>
<g style="fill:rgb(72.2%25,52.5%25,4.3%25);fill-opacity:1;">
<use xlink:href="%23glyph-1829020-10" x="337.738" y="218.333333"/>
<use xlink:href="%23glyph-1829020-2" x="338.898" y="218.333333"/>
</g>
<g style="fill:rgb(72.2%25,52.5%25,4.3%25);fill-opacity:1;">
<use xlink:href="%23glyph-1829020-1" x="346.578" y="218.333333"/>
<use xlink:href="%23glyph-1829020-2" x="347.738" y="218.333333"/>
<use xlink:href="%23glyph-1829020-2" x="348.898" y="218.333333"/>
</g>
<g style="fill:rgb(72.2%25,52.5%25,4.3%25);fill-opacity:1;">
<use xlink:href="%23glyph-1829020-1" x="356.578" y="218.333333"/>
<use xlink:href="%23glyph-1829020-1" x="357.738" y="218.333333"/>
<use xlink:href="%23glyph-1829020-2" x="358.898" y="218.333333"/>
</g>
<g style="fill:rgb(72.2%25,52.5%25,4.3%25);fill-opacity:1;">
<use xlink:href="%23glyph-1829020-1" x="366.578" y="218.333333"/>
<use xlink:href="%23glyph-1829020-3" x="367.738" y="218.333333"/>
<use xlink:href="%23glyph-1829020-2" x="368.898" y="218.333333"/>
</g>
<g style="fill:rgb(72.2%25,52.5%25,4.3%25);fill-opacity:1;">
<use xlink:href="%23glyph-1829020-1" x="376.578" y="218.333333"/>
<use xlink:href="%23glyph-1829020-4" x="377.738" y="218.333333"/>
<use xlink:href="%23glyph-1829020-2" x="378.898" y="218.333333"/>
</g>
<g style="fill:rgb(72.2%25,52.5%25,4.3%25);fill-opacity:1;">
<use xlink:href="%23glyph-1829020-1" x="386.578" y="218.333333"/>
<use xlink:href="%23glyph-1829020-5" x="387.738" y="218.333333"/>
<use xlink:href="%23glyph-1829020-2" x="388.898" y="218.333333"/>
</g>
<g style="fill:rgb(72.2%25,52.5%25,4.3%25);fill-opacity:1;">
<use xlink:href="%23glyph-1829020-1" x="396.578" y="218.333333"/>
<use xlink:href="%23glyph-1829020-6" x="397.738" y="218.333333"/>
<use xlink:href="%23glyph-1829020-2" x="398.898" y="218.333333"/>
</g>
<g style="fill:rgb(72.2%25,52.5%25,4.3%25);fill-opacity:1;">
<use xlink:href="%23glyph-1829020-1" x="406.578" y="218.333333"/>
<use xlink:href="%23glyph-1829020-7" x="407.738" y="218.333333"/>
<use xlink:href="%23glyph-1829020-2" x="408.898" y="218.333333"/>
</g>
<g style="fill:rgb(72.2%25,52.5%25,4.3%25);fill-opacity:1;">
<use xlink:href="%23glyph-1829020-1" x="416.578" y="218.333333"/>
<use xlink:href="%23glyph-1829020-8" x="417.738" y="218.333333"/>
<use xlink:href="%23glyph-1829020-2" x="418.898" y="218.333333"/>
</g>
<g style="fill:rgb(72.2%25,52.5%25,4.3%25);fill-opacity:1;">
<use xlink:href="%23glyph-1829020-1" x="426.578" y="218.333333"/>
<use xlink:href="%23glyph-1829020-9" x="427.738" y="218.333333"/>
<use xlink:href="%23glyph-1829020-2" x="428.898" y="218.333333"/>
</g>
<g style="fill:rgb(72.2%25,52.5%25,4.3%25);fill-opacity:1;">
<use xlink:href="%23glyph-1829020-1" x="436.578" y="218.333333"/>
<use xlink:href="%23glyph-1829020-10" x="437.738" y="218.333333"/>
<use xlink:href="%23glyph-1829020-2" x="438.898" y="218.333333"/>
</g>
<g style="fill:rgb(72.2%25,52.5%25,4.3%25);fill-opacity:1;">
<use xlink:href="%23glyph-1829020-3" x="446.578" y="218.333333"/>
<use xlink:href="%23glyph-1829020-2" x="447.738" y="218.333333"/>
<use xlink:href="%23glyph-1829020-2" x="448.898" y="218.333333"/>
</g>
<g style="fill:rgb(72.2%25,52.5%25,4.3%25);fill-opacity:1;">
<use xlink:href="%23glyph-1829021-1" x="243.333333" y="232.738"/>
<use xlink:href="%23glyph-1829021-2" x="243.333333" y="233.898"/>
</g>
<g style="fill:rgb(72.2%25,52.5%25,4.3%25);fill-opacity:1;">
<use xlink:href="%23glyph-1829021-3" x="243.333333" y="242.738"/>
<use xlink:href="%23glyph-1829021-2" x="243.333333" y="243.898"/>
</g>
<g style="fill:rgb(72.2%25,52.5%25,4.3%25);fill-opacity:1;">
<use xlink:href="%23glyph-1829021-4" x="243.333333" y="252.738"/>
<use xlink:href="%23glyph-1829021-2" x="243.333333" y="253.898"/>
</g>
<g style="fill:rgb(72.2%25,52.5%25,4.3%25);fill-opacity:1;">
<use xlink:href="%23glyph-1829021-5" x="243.333333" y="262.738"/>
<use xlink:href="%23glyph-1829021-2" x="243.333333" y="263.898"/>
</g>
<g style="fill:rgb(72.2%25,52.5%25,4.3%25);fill-opacity:1;">
<use xlink:href="%23glyph-1829021-6" x="243.333333" y="272.738"/>
<use xlink:href="%23glyph-1829021-2" x="243.333333" y="273.898"/>
</g>
<g style="fill:rgb(72.2%25,52.5%25,4.3%25);fill-opacity:1;">
<use xlink:href="%23glyph-1829021-7" x="243.333333" y="282.738"/>
<use xlink:href="%23glyph-1829021-2" x="243.333333" y="283.898"/>
</g>
<g style="fill:rgb(72.2%25,52.5%25,4.3%25);fill-opacity:1;">
<use xlink:href="%23glyph-1829021-8" x="243.333333" y="292.738"/>
<use xlink:href="%23glyph-1829021-2" x="243.333333" y="293.898"/>
</g>
<g style="fill:rgb(72.2%25,52.5%25,4.3%25);fill-opacity:1;">
<use xlink:href="%23glyph-1829021-9" x="243.333333" y="302.738"/>
<use xlink:href="%23glyph-1829021-2" x="243.333333" y="303.898"/>
</g>
<g style="fill:rgb(72.2%25,52.5%25,4.3%25);fill-opacity:1;">
<use xlink:href="%23glyph-1829021-10" x="243.333333" y="312.738"/>
<use xlink:href="%23glyph-1829021-2" x="243.333333" y="313.898"/>
</g>
<g style="fill:rgb(72.2%25,52.5%25,4.3%25);fill-opacity:1;">
<use xlink:href="%23glyph-1829021-1" x="243.333333" y="321.578"/>
<use xlink:href="%23glyph-1829021-2" x="243.333333" y="322.738"/>
<use xlink:href="%23glyph-1829021-2" x="243.333333" y="323.898"/>
</g>
<g style="fill:rgb(72.2%25,52.5%25,4.3%25);fill-opacity:1;">
<use xlink:href="%23glyph-1829021-1" x="243.333333" y="331.578"/>
<use xlink:href="%23glyph-1829021-1" x="243.333333" y="332.738"/>
<use xlink:href="%23glyph-1829021-2" x="243.333333" y="333.898"/>
</g>
<g style="fill:rgb(72.2%25,52.5%25,4.3%25);fill-opacity:1;">
<use xlink:href="%23glyph-1829021-1" x="243.333333" y="341.578"/>
<use xlink:href="%23glyph-1829021-3" x="243.333333" y="342.738"/>
<use xlink:href="%23glyph-1829021-2" x="243.333333" y="343.898"/>
</g>
<g style="fill:rgb(72.2%25,52.5%25,4.3%25);fill-opacity:1;">
<use xlink:href="%23glyph-1829021-1" x="243.333333" y="351.578"/>
<use xlink:href="%23glyph-1829021-4" x="243.333333" y="352.738"/>
<use xlink:href="%23glyph-1829021-2" x="243.333333" y="353.898"/>
</g>
<g style="fill:rgb(72.2%25,52.5%25,4.3%25);fill-opacity:1;">
<use xlink:href="%23glyph-1829021-1" x="243.333333" y="361.578"/>
<use xlink:href="%23glyph-1829021-5" x="243.333333" y="362.738"/>
<use xlink:href="%23glyph-1829021-2" x="243.333333" y="363.898"/>
</g>
<g style="fill:rgb(72.2%25,52.5%25,4.3%25);fill-opacity:1;">
<use xlink:href="%23glyph-1829021-1" x="243.333333" y="371.578"/>
<use xlink:href="%23glyph-1829021-6" x="243.333333" y="372.738"/>
<use xlink:href="%23glyph-1829021-2" x="243.333333" y="373.898"/>
</g>
<g style="fill:rgb(72.2%25,52.5%25,4.3%25);fill-opacity:1;">
<use xlink:href="%23glyph-1829021-1" x="243.333333" y="381.578"/>
<use xlink:href="%23glyph-1829021-7" x="243.333333" y="382.738"/>
<use xlink:href="%23glyph-1829021-2" x="243.333333" y="383.898"/>
</g>
<g style="fill:rgb(72.2%25,52.5%25,4.3%25);fill-opacity:1;">
<use xlink:href="%23glyph-1829021-1" x="243.333333" y="391.578"/>
<use xlink:href="%23glyph-1829021-8" x="243.333333" y="392.738"/>
<use xlink:href="%23glyph-1829021-2" x="243.333333" y="393.898"/>
</g>
<g style="fill:rgb(72.2%25,52.5%25,4.3%25);fill-opacity:1;">
<use xlink:href="%23glyph-1829021-1" x="243.333333" y="401.578"/>
<use xlink:href="%23glyph-1829021-9" x="243.333333" y="402.738"/>
<use xlink:href="%23glyph-1829021-2" x="243.333333" y="403.898"/>
</g>
<g style="fill:rgb(72.2%25,52.5%25,4.3%25);fill-opacity:1;">
<use xlink:href="%23glyph-1829021-1" x="243.333333" y="411.578"/>
<use xlink:href="%23glyph-1829021-10" x="243.333333" y="412.738"/>
<use xlink:href="%23glyph-1829021-2" x="243.333333" y="413.898"/>
</g>
<g style="fill:rgb(72.2%25,52.5%25,4.3%25);fill-opacity:1;">
<use xlink:href="%23glyph-1829021-3" x="243.333333" y="421.578"/>
<use xlink:href="%23glyph-1829021-2" x="243.333333" y="422.738"/>
<use xlink:href="%23glyph-1829021-2" x="243.333333" y="423.898"/>
</g>
<g style="fill:rgb(72.2%25,52.5%25,4.3%25);fill-opacity:1;">
<use xlink:href="%23glyph-1829022-1" x="430.355" y="250.38125"/>
</g>
<g style="fill:rgb(72.2%25,52.5%25,4.3%25);fill-opacity:1;">
<use xlink:href="%23glyph-1829023-1" x="214.61875" y="395.5725"/>
</g>
<g style="fill:rgb(100%25,100%25,100%25);fill-opacity:1;">
<use xlink:href="%23glyph-1829022-1" x="260.355" y="220.38125"/>
</g>
<g style="fill:rgb(100%25,100%25,100%25);fill-opacity:1;">
<use xlink:href="%23glyph-1829023-1" x="237.952083" y="222.239167"/>
</g>
<path style="fill:none;stroke-width:0.25;stroke-linecap:butt;stroke-linejoin:miter;stroke:rgb(100%25,100%25,100%25);stroke-opacity:1;stroke-miterlimit:10;" d="M 252 225 C 252 226.105469 251.105469 227 250 227 C 248.894531 227 248 226.105469 248 225 C 248 223.894531 248.894531 223 250 223 C 251.105469 223 252 223.894531 252 225 Z M 252 225 "/>
<path style=" stroke:none;fill-rule:nonzero;fill:rgb(100%25,100%25,100%25);fill-opacity:0.5;" d="M 252 225 C 252 226.105469 251.105469 227 250 227 C 248.894531 227 248 226.105469 248 225 C 248 223.894531 248.894531 223 250 223 C 251.105469 223 252 223.894531 252 225 Z M 252 225 "/>
<path style="fill:none;stroke-width:1;stroke-linecap:butt;stroke-linejoin:miter;stroke:rgb(0%25,0%25,0%25);stroke-opacity:1;stroke-miterlimit:10;" d="M 550 225 L 595.867188 133.261719 "/>
<path style=" stroke:none;fill-rule:nonzero;fill:rgb(0%25,0%25,0%25);fill-opacity:1;" d="M 599.292969 134.976562 L 600 125 L 592.445312 131.550781 "/>
<path style="fill-rule:nonzero;fill:rgb(100%25,54.9%25,0%25);fill-opacity:0.5;stroke-width:0.25;stroke-linecap:butt;stroke-linejoin:miter;stroke:rgb(100%25,54.9%25,0%25);stroke-opacity:0.5;stroke-miterlimit:10;" d="M 550 225 L 550 245 L 750 245 L 750 225 Z M 550 225 "/>
<path style="fill-rule:nonzero;fill:rgb(100%25,54.9%25,0%25);fill-opacity:0.5;stroke-width:0.25;stroke-linecap:butt;stroke-linejoin:miter;stroke:rgb(100%25,54.9%25,0%25);stroke-opacity:0.5;stroke-miterlimit:10;" d="M 530 25 L 530 225 L 550 225 L 550 25 Z M 530 25 "/>
<path style="fill:none;stroke-width:0.25;stroke-linecap:butt;stroke-linejoin:miter;stroke:rgb(72.2%25,52.5%25,4.3%25);stroke-opacity:1;stroke-miterlimit:10;" d="M 550 225 L 550 230 "/>
<path style="fill:none;stroke-width:0.25;stroke-linecap:butt;stroke-linejoin:miter;stroke:rgb(72.2%25,52.5%25,4.3%25);stroke-opacity:1;stroke-miterlimit:10;" d="M 560 225 L 560 230 "/>
<path style="fill:none;stroke-width:0.25;stroke-linecap:butt;stroke-linejoin:miter;stroke:rgb(72.2%25,52.5%25,4.3%25);stroke-opacity:1;stroke-miterlimit:10;" d="M 570 225 L 570 230 "/>
<path style="fill:none;stroke-width:0.25;stroke-linecap:butt;stroke-linejoin:miter;stroke:rgb(72.2%25,52.5%25,4.3%25);stroke-opacity:1;stroke-miterlimit:10;" d="M 580 225 L 580 230 "/>
<path style="fill:none;stroke-width:0.25;stroke-linecap:butt;stroke-linejoin:miter;stroke:rgb(72.2%25,52.5%25,4.3%25);stroke-opacity:1;stroke-miterlimit:10;" d="M 590 225 L 590 230 "/>
<path style="fill:none;stroke-width:0.25;stroke-linecap:butt;stroke-linejoin:miter;stroke:rgb(72.2%25,52.5%25,4.3%25);stroke-opacity:1;stroke-miterlimit:10;" d="M 600 225 L 600 230 "/>
<path style="fill:none;stroke-width:0.25;stroke-linecap:butt;stroke-linejoin:miter;stroke:rgb(72.2%25,52.5%25,4.3%25);stroke-opacity:1;stroke-miterlimit:10;" d="M 610 225 L 610 230 "/>
<path style="fill:none;stroke-width:0.25;stroke-linecap:butt;stroke-linejoin:miter;stroke:rgb(72.2%25,52.5%25,4.3%25);stroke-opacity:1;stroke-miterlimit:10;" d="M 620 225 L 620 230 "/>
<path style="fill:none;stroke-width:0.25;stroke-linecap:butt;stroke-linejoin:miter;stroke:rgb(72.2%25,52.5%25,4.3%25);stroke-opacity:1;stroke-miterlimit:10;" d="M 630 225 L 630 230 "/>
<path style="fill:none;stroke-width:0.25;stroke-linecap:butt;stroke-linejoin:miter;stroke:rgb(72.2%25,52.5%25,4.3%25);stroke-opacity:1;stroke-miterlimit:10;" d="M 640 225 L 640 230 "/>
<path style="fill:none;stroke-width:0.25;stroke-linecap:butt;stroke-linejoin:miter;stroke:rgb(72.2%25,52.5%25,4.3%25);stroke-opacity:1;stroke-miterlimit:10;" d="M 650 225 L 650 230 "/>
<path style="fill:none;stroke-width:0.25;stroke-linecap:butt;stroke-linejoin:miter;stroke:rgb(72.2%25,52.5%25,4.3%25);stroke-opacity:1;stroke-miterlimit:10;" d="M 660 225 L 660 230 "/>
<path style="fill:none;stroke-width:0.25;stroke-linecap:butt;stroke-linejoin:miter;stroke:rgb(72.2%25,52.5%25,4.3%25);stroke-opacity:1;stroke-miterlimit:10;" d="M 670 225 L 670 230 "/>
<path style="fill:none;stroke-width:0.25;stroke-linecap:butt;stroke-linejoin:miter;stroke:rgb(72.2%25,52.5%25,4.3%25);stroke-opacity:1;stroke-miterlimit:10;" d="M 680 225 L 680 230 "/>
<path style="fill:none;stroke-width:0.25;stroke-linecap:butt;stroke-linejoin:miter;stroke:rgb(72.2%25,52.5%25,4.3%25);stroke-opacity:1;stroke-miterlimit:10;" d="M 690 225 L 690 230 "/>
<path style="fill:none;stroke-width:0.25;stroke-linecap:butt;stroke-linejoin:miter;stroke:rgb(72.2%25,52.5%25,4.3%25);stroke-opacity:1;stroke-miterlimit:10;" d="M 700 225 L 700 230 "/>
<path style="fill:none;stroke-width:0.25;stroke-linecap:butt;stroke-linejoin:miter;stroke:rgb(72.2%25,52.5%25,4.3%25);stroke-opacity:1;stroke-miterlimit:10;" d="M 710 225 L 710 230 "/>
<path style="fill:none;stroke-width:0.25;stroke-linecap:butt;stroke-linejoin:miter;stroke:rgb(72.2%25,52.5%25,4.3%25);stroke-opacity:1;stroke-miterlimit:10;" d="M 720 225 L 720 230 "/>
<path style="fill:none;stroke-width:0.25;stroke-linecap:butt;stroke-linejoin:miter;stroke:rgb(72.2%25,52.5%25,4.3%25);stroke-opacity:1;stroke-miterlimit:10;" d="M 730 225 L 730 230 "/>
<path style="fill:none;stroke-width:0.25;stroke-linecap:butt;stroke-linejoin:miter;stroke:rgb(72.2%25,52.5%25,4.3%25);stroke-opacity:1;stroke-miterlimit:10;" d="M 740 225 L 740 230 "/>
<path style="fill:none;stroke-width:0.25;stroke-linecap:butt;stroke-linejoin:miter;stroke:rgb(72.2%25,52.5%25,4.3%25);stroke-opacity:1;stroke-miterlimit:10;" d="M 750 225 L 750 230 "/>
<path style="fill:none;stroke-width:0.25;stroke-linecap:butt;stroke-linejoin:miter;stroke:rgb(72.2%25,52.5%25,4.3%25);stroke-opacity:1;stroke-miterlimit:10;" d="M 545 225 L 550 225 "/>
<path style="fill:none;stroke-width:0.25;stroke-linecap:butt;stroke-linejoin:miter;stroke:rgb(72.2%25,52.5%25,4.3%25);stroke-opacity:1;stroke-miterlimit:10;" d="M 545 215 L 550 215 "/>
<path style="fill:none;stroke-width:0.25;stroke-linecap:butt;stroke-linejoin:miter;stroke:rgb(72.2%25,52.5%25,4.3%25);stroke-opacity:1;stroke-miterlimit:10;" d="M 545 205 L 550 205 "/>
<path style="fill:none;stroke-width:0.25;stroke-linecap:butt;stroke-linejoin:miter;stroke:rgb(72.2%25,52.5%25,4.3%25);stroke-opacity:1;stroke-miterlimit:10;" d="M 545 195 L 550 195 "/>
<path style="fill:none;stroke-width:0.25;stroke-linecap:butt;stroke-linejoin:miter;stroke:rgb(72.2%25,52.5%25,4.3%25);stroke-opacity:1;stroke-miterlimit:10;" d="M 545 185 L 550 185 "/>
<path style="fill:none;stroke-width:0.25;stroke-linecap:butt;stroke-linejoin:miter;stroke:rgb(72.2%25,52.5%25,4.3%25);stroke-opacity:1;stroke-miterlimit:10;" d="M 545 175 L 550 175 "/>
<path style="fill:none;stroke-width:0.25;stroke-linecap:butt;stroke-linejoin:miter;stroke:rgb(72.2%25,52.5%25,4.3%25);stroke-opacity:1;stroke-miterlimit:10;" d="M 545 165 L 550 165 "/>
<path style="fill:none;stroke-width:0.25;stroke-linecap:butt;stroke-linejoin:miter;stroke:rgb(72.2%25,52.5%25,4.3%25);stroke-opacity:1;stroke-miterlimit:10;" d="M 545 155 L 550 155 "/>
<path style="fill:none;stroke-width:0.25;stroke-linecap:butt;stroke-linejoin:miter;stroke:rgb(72.2%25,52.5%25,4.3%25);stroke-opacity:1;stroke-miterlimit:10;" d="M 545 145 L 550 145 "/>
<path style="fill:none;stroke-width:0.25;stroke-linecap:butt;stroke-linejoin:miter;stroke:rgb(72.2%25,52.5%25,4.3%25);stroke-opacity:1;stroke-miterlimit:10;" d="M 545 135 L 550 135 "/>
<path style="fill:none;stroke-width:0.25;stroke-linecap:butt;stroke-linejoin:miter;stroke:rgb(72.2%25,52.5%25,4.3%25);stroke-opacity:1;stroke-miterlimit:10;" d="M 545 125 L 550 125 "/>
<path style="fill:none;stroke-width:0.25;stroke-linecap:butt;stroke-linejoin:miter;stroke:rgb(72.2%25,52.5%25,4.3%25);stroke-opacity:1;stroke-miterlimit:10;" d="M 545 115 L 550 115 "/>
<path style="fill:none;stroke-width:0.25;stroke-linecap:butt;stroke-linejoin:miter;stroke:rgb(72.2%25,52.5%25,4.3%25);stroke-opacity:1;stroke-miterlimit:10;" d="M 545 105 L 550 105 "/>
<path style="fill:none;stroke-width:0.25;stroke-linecap:butt;stroke-linejoin:miter;stroke:rgb(72.2%25,52.5%25,4.3%25);stroke-opacity:1;stroke-miterlimit:10;" d="M 545 95 L 550 95 "/>
<path style="fill:none;stroke-width:0.25;stroke-linecap:butt;stroke-linejoin:miter;stroke:rgb(72.2%25,52.5%25,4.3%25);stroke-opacity:1;stroke-miterlimit:10;" d="M 545 85 L 550 85 "/>
<path style="fill:none;stroke-width:0.25;stroke-linecap:butt;stroke-linejoin:miter;stroke:rgb(72.2%25,52.5%25,4.3%25);stroke-opacity:1;stroke-miterlimit:10;" d="M 545 75 L 550 75 "/>
<path style="fill:none;stroke-width:0.25;stroke-linecap:butt;stroke-linejoin:miter;stroke:rgb(72.2%25,52.5%25,4.3%25);stroke-opacity:1;stroke-miterlimit:10;" d="M 545 65 L 550 65 "/>
<path style="fill:none;stroke-width:0.25;stroke-linecap:butt;stroke-linejoin:miter;stroke:rgb(72.2%25,52.5%25,4.3%25);stroke-opacity:1;stroke-miterlimit:10;" d="M 545 55 L 550 55 "/>
<path style="fill:none;stroke-width:0.25;stroke-linecap:butt;stroke-linejoin:miter;stroke:rgb(72.2%25,52.5%25,4.3%25);stroke-opacity:1;stroke-miterlimit:10;" d="M 545 45 L 550 45 "/>
<path style="fill:none;stroke-width:0.25;stroke-linecap:butt;stroke-linejoin:miter;stroke:rgb(72.2%25,52.5%25,4.3%25);stroke-opacity:1;stroke-miterlimit:10;" d="M 545 35 L 550 35 "/>
<path style="fill:none;stroke-width:0.25;stroke-linecap:butt;stroke-linejoin:miter;stroke:rgb(72.2%25,52.5%25,4.3%25);stroke-opacity:1;stroke-miterlimit:10;" d="M 545 25 L 550 25 "/>
<path style="fill:none;stroke-width:0.25;stroke-linecap:butt;stroke-linejoin:miter;stroke:rgb(72.2%25,52.5%25,4.3%25);stroke-opacity:1;stroke-miterlimit:10;" d="M 550 225 L 550 228.332031 "/>
<path style="fill:none;stroke-width:0.25;stroke-linecap:butt;stroke-linejoin:miter;stroke:rgb(72.2%25,52.5%25,4.3%25);stroke-opacity:1;stroke-miterlimit:10;" d="M 555 225 L 555 228.332031 "/>
<path style="fill:none;stroke-width:0.25;stroke-linecap:butt;stroke-linejoin:miter;stroke:rgb(72.2%25,52.5%25,4.3%25);stroke-opacity:1;stroke-miterlimit:10;" d="M 560 225 L 560 228.332031 "/>
<path style="fill:none;stroke-width:0.25;stroke-linecap:butt;stroke-linejoin:miter;stroke:rgb(72.2%25,52.5%25,4.3%25);stroke-opacity:1;stroke-miterlimit:10;" d="M 565 225 L 565 228.332031 "/>
<path style="fill:none;stroke-width:0.25;stroke-linecap:butt;stroke-linejoin:miter;stroke:rgb(72.2%25,52.5%25,4.3%25);stroke-opacity:1;stroke-miterlimit:10;" d="M 570 225 L 570 228.332031 "/>
<path style="fill:none;stroke-width:0.25;stroke-linecap:butt;stroke-linejoin:miter;stroke:rgb(72.2%25,52.5%25,4.3%25);stroke-opacity:1;stroke-miterlimit:10;" d="M 575 225 L 575 228.332031 "/>
<path style="fill:none;stroke-width:0.25;stroke-linecap:butt;stroke-linejoin:miter;stroke:rgb(72.2%25,52.5%25,4.3%25);stroke-opacity:1;stroke-miterlimit:10;" d="M 580 225 L 580 228.332031 "/>
<path style="fill:none;stroke-width:0.25;stroke-linecap:butt;stroke-linejoin:miter;stroke:rgb(72.2%25,52.5%25,4.3%25);stroke-opacity:1;stroke-miterlimit:10;" d="M 585 225 L 585 228.332031 "/>
<path style="fill:none;stroke-width:0.25;stroke-linecap:butt;stroke-linejoin:miter;stroke:rgb(72.2%25,52.5%25,4.3%25);stroke-opacity:1;stroke-miterlimit:10;" d="M 590 225 L 590 228.332031 "/>
<path style="fill:none;stroke-width:0.25;stroke-linecap:butt;stroke-linejoin:miter;stroke:rgb(72.2%25,52.5%25,4.3%25);stroke-opacity:1;stroke-miterlimit:10;" d="M 595 225 L 595 228.332031 "/>
<path style="fill:none;stroke-width:0.25;stroke-linecap:butt;stroke-linejoin:miter;stroke:rgb(72.2%25,52.5%25,4.3%25);stroke-opacity:1;stroke-miterlimit:10;" d="M 600 225 L 600 228.332031 "/>
<path style="fill:none;stroke-width:0.25;stroke-linecap:butt;stroke-linejoin:miter;stroke:rgb(72.2%25,52.5%25,4.3%25);stroke-opacity:1;stroke-miterlimit:10;" d="M 605 225 L 605 228.332031 "/>
<path style="fill:none;stroke-width:0.25;stroke-linecap:butt;stroke-linejoin:miter;stroke:rgb(72.2%25,52.5%25,4.3%25);stroke-opacity:1;stroke-miterlimit:10;" d="M 610 225 L 610 228.332031 "/>
<path style="fill:none;stroke-width:0.25;stroke-linecap:butt;stroke-linejoin:miter;stroke:rgb(72.2%25,52.5%25,4.3%25);stroke-opacity:1;stroke-miterlimit:10;" d="M 615 225 L 615 228.332031 "/>
<path style="fill:none;stroke-width:0.25;stroke-linecap:butt;stroke-linejoin:miter;stroke:rgb(72.2%25,52.5%25,4.3%25);stroke-opacity:1;stroke-miterlimit:10;" d="M 620 225 L 620 228.332031 "/>
<path style="fill:none;stroke-width:0.25;stroke-linecap:butt;stroke-linejoin:miter;stroke:rgb(72.2%25,52.5%25,4.3%25);stroke-opacity:1;stroke-miterlimit:10;" d="M 625 225 L 625 228.332031 "/>
<path style="fill:none;stroke-width:0.25;stroke-linecap:butt;stroke-linejoin:miter;stroke:rgb(72.2%25,52.5%25,4.3%25);stroke-opacity:1;stroke-miterlimit:10;" d="M 630 225 L 630 228.332031 "/>
<path style="fill:none;stroke-width:0.25;stroke-linecap:butt;stroke-linejoin:miter;stroke:rgb(72.2%25,52.5%25,4.3%25);stroke-opacity:1;stroke-miterlimit:10;" d="M 635 225 L 635 228.332031 "/>
<path style="fill:none;stroke-width:0.25;stroke-linecap:butt;stroke-linejoin:miter;stroke:rgb(72.2%25,52.5%25,4.3%25);stroke-opacity:1;stroke-miterlimit:10;" d="M 640 225 L 640 228.332031 "/>
<path style="fill:none;stroke-width:0.25;stroke-linecap:butt;stroke-linejoin:miter;stroke:rgb(72.2%25,52.5%25,4.3%25);stroke-opacity:1;stroke-miterlimit:10;" d="M 645 225 L 645 228.332031 "/>
<path style="fill:none;stroke-width:0.25;stroke-linecap:butt;stroke-linejoin:miter;stroke:rgb(72.2%25,52.5%25,4.3%25);stroke-opacity:1;stroke-miterlimit:10;" d="M 650 225 L 650 228.332031 "/>
<path style="fill:none;stroke-width:0.25;stroke-linecap:butt;stroke-linejoin:miter;stroke:rgb(72.2%25,52.5%25,4.3%25);stroke-opacity:1;stroke-miterlimit:10;" d="M 655 225 L 655 228.332031 "/>
<path style="fill:none;stroke-width:0.25;stroke-linecap:butt;stroke-linejoin:miter;stroke:rgb(72.2%25,52.5%25,4.3%25);stroke-opacity:1;stroke-miterlimit:10;" d="M 660 225 L 660 228.332031 "/>
<path style="fill:none;stroke-width:0.25;stroke-linecap:butt;stroke-linejoin:miter;stroke:rgb(72.2%25,52.5%25,4.3%25);stroke-opacity:1;stroke-miterlimit:10;" d="M 665 225 L 665 228.332031 "/>
<path style="fill:none;stroke-width:0.25;stroke-linecap:butt;stroke-linejoin:miter;stroke:rgb(72.2%25,52.5%25,4.3%25);stroke-opacity:1;stroke-miterlimit:10;" d="M 670 225 L 670 228.332031 "/>
<path style="fill:none;stroke-width:0.25;stroke-linecap:butt;stroke-linejoin:miter;stroke:rgb(72.2%25,52.5%25,4.3%25);stroke-opacity:1;stroke-miterlimit:10;" d="M 675 225 L 675 228.332031 "/>
<path style="fill:none;stroke-width:0.25;stroke-linecap:butt;stroke-linejoin:miter;stroke:rgb(72.2%25,52.5%25,4.3%25);stroke-opacity:1;stroke-miterlimit:10;" d="M 680 225 L 680 228.332031 "/>
<path style="fill:none;stroke-width:0.25;stroke-linecap:butt;stroke-linejoin:miter;stroke:rgb(72.2%25,52.5%25,4.3%25);stroke-opacity:1;stroke-miterlimit:10;" d="M 685 225 L 685 228.332031 "/>
<path style="fill:none;stroke-width:0.25;stroke-linecap:butt;stroke-linejoin:miter;stroke:rgb(72.2%25,52.5%25,4.3%25);stroke-opacity:1;stroke-miterlimit:10;" d="M 690 225 L 690 228.332031 "/>
<path style="fill:none;stroke-width:0.25;stroke-linecap:butt;stroke-linejoin:miter;stroke:rgb(72.2%25,52.5%25,4.3%25);stroke-opacity:1;stroke-miterlimit:10;" d="M 695 225 L 695 228.332031 "/>
<path style="fill:none;stroke-width:0.25;stroke-linecap:butt;stroke-linejoin:miter;stroke:rgb(72.2%25,52.5%25,4.3%25);stroke-opacity:1;stroke-miterlimit:10;" d="M 700 225 L 700 228.332031 "/>
<path style="fill:none;stroke-width:0.25;stroke-linecap:butt;stroke-linejoin:miter;stroke:rgb(72.2%25,52.5%25,4.3%25);stroke-opacity:1;stroke-miterlimit:10;" d="M 705 225 L 705 228.332031 "/>
<path style="fill:none;stroke-width:0.25;stroke-linecap:butt;stroke-linejoin:miter;stroke:rgb(72.2%25,52.5%25,4.3%25);stroke-opacity:1;stroke-miterlimit:10;" d="M 710 225 L 710 228.332031 "/>
<path style="fill:none;stroke-width:0.25;stroke-linecap:butt;stroke-linejoin:miter;stroke:rgb(72.2%25,52.5%25,4.3%25);stroke-opacity:1;stroke-miterlimit:10;" d="M 715 225 L 715 228.332031 "/>
<path style="fill:none;stroke-width:0.25;stroke-linecap:butt;stroke-linejoin:miter;stroke:rgb(72.2%25,52.5%25,4.3%25);stroke-opacity:1;stroke-miterlimit:10;" d="M 720 225 L 720 228.332031 "/>
<path style="fill:none;stroke-width:0.25;stroke-linecap:butt;stroke-linejoin:miter;stroke:rgb(72.2%25,52.5%25,4.3%25);stroke-opacity:1;stroke-miterlimit:10;" d="M 725 225 L 725 228.332031 "/>
<path style="fill:none;stroke-width:0.25;stroke-linecap:butt;stroke-linejoin:miter;stroke:rgb(72.2%25,52.5%25,4.3%25);stroke-opacity:1;stroke-miterlimit:10;" d="M 730 225 L 730 228.332031 "/>
<path style="fill:none;stroke-width:0.25;stroke-linecap:butt;stroke-linejoin:miter;stroke:rgb(72.2%25,52.5%25,4.3%25);stroke-opacity:1;stroke-miterlimit:10;" d="M 735 225 L 735 228.332031 "/>
<path style="fill:none;stroke-width:0.25;stroke-linecap:butt;stroke-linejoin:miter;stroke:rgb(72.2%25,52.5%25,4.3%25);stroke-opacity:1;stroke-miterlimit:10;" d="M 740 225 L 740 228.332031 "/>
<path style="fill:none;stroke-width:0.25;stroke-linecap:butt;stroke-linejoin:miter;stroke:rgb(72.2%25,52.5%25,4.3%25);stroke-opacity:1;stroke-miterlimit:10;" d="M 745 225 L 745 228.332031 "/>
<path style="fill:none;stroke-width:0.25;stroke-linecap:butt;stroke-linejoin:miter;stroke:rgb(72.2%25,52.5%25,4.3%25);stroke-opacity:1;stroke-miterlimit:10;" d="M 750 225 L 750 228.332031 "/>
<path style="fill:none;stroke-width:0.25;stroke-linecap:butt;stroke-linejoin:miter;stroke:rgb(72.2%25,52.5%25,4.3%25);stroke-opacity:1;stroke-miterlimit:10;" d="M 546.667969 225 L 550 225 "/>
<path style="fill:none;stroke-width:0.25;stroke-linecap:butt;stroke-linejoin:miter;stroke:rgb(72.2%25,52.5%25,4.3%25);stroke-opacity:1;stroke-miterlimit:10;" d="M 546.667969 220 L 550 220 "/>
<path style="fill:none;stroke-width:0.25;stroke-linecap:butt;stroke-linejoin:miter;stroke:rgb(72.2%25,52.5%25,4.3%25);stroke-opacity:1;stroke-miterlimit:10;" d="M 546.667969 215 L 550 215 "/>
<path style="fill:none;stroke-width:0.25;stroke-linecap:butt;stroke-linejoin:miter;stroke:rgb(72.2%25,52.5%25,4.3%25);stroke-opacity:1;stroke-miterlimit:10;" d="M 546.667969 210 L 550 210 "/>
<path style="fill:none;stroke-width:0.25;stroke-linecap:butt;stroke-linejoin:miter;stroke:rgb(72.2%25,52.5%25,4.3%25);stroke-opacity:1;stroke-miterlimit:10;" d="M 546.667969 205 L 550 205 "/>
<path style="fill:none;stroke-width:0.25;stroke-linecap:butt;stroke-linejoin:miter;stroke:rgb(72.2%25,52.5%25,4.3%25);stroke-opacity:1;stroke-miterlimit:10;" d="M 546.667969 200 L 550 200 "/>
<path style="fill:none;stroke-width:0.25;stroke-linecap:butt;stroke-linejoin:miter;stroke:rgb(72.2%25,52.5%25,4.3%25);stroke-opacity:1;stroke-miterlimit:10;" d="M 546.667969 195 L 550 195 "/>
<path style="fill:none;stroke-width:0.25;stroke-linecap:butt;stroke-linejoin:miter;stroke:rgb(72.2%25,52.5%25,4.3%25);stroke-opacity:1;stroke-miterlimit:10;" d="M 546.667969 190 L 550 190 "/>
<path style="fill:none;stroke-width:0.25;stroke-linecap:butt;stroke-linejoin:miter;stroke:rgb(72.2%25,52.5%25,4.3%25);stroke-opacity:1;stroke-miterlimit:10;" d="M 546.667969 185 L 550 185 "/>
<path style="fill:none;stroke-width:0.25;stroke-linecap:butt;stroke-linejoin:miter;stroke:rgb(72.2%25,52.5%25,4.3%25);stroke-opacity:1;stroke-miterlimit:10;" d="M 546.667969 180 L 550 180 "/>
<path style="fill:none;stroke-width:0.25;stroke-linecap:butt;stroke-linejoin:miter;stroke:rgb(72.2%25,52.5%25,4.3%25);stroke-opacity:1;stroke-miterlimit:10;" d="M 546.667969 175 L 550 175 "/>
<path style="fill:none;stroke-width:0.25;stroke-linecap:butt;stroke-linejoin:miter;stroke:rgb(72.2%25,52.5%25,4.3%25);stroke-opacity:1;stroke-miterlimit:10;" d="M 546.667969 170 L 550 170 "/>
<path style="fill:none;stroke-width:0.25;stroke-linecap:butt;stroke-linejoin:miter;stroke:rgb(72.2%25,52.5%25,4.3%25);stroke-opacity:1;stroke-miterlimit:10;" d="M 546.667969 165 L 550 165 "/>
<path style="fill:none;stroke-width:0.25;stroke-linecap:butt;stroke-linejoin:miter;stroke:rgb(72.2%25,52.5%25,4.3%25);stroke-opacity:1;stroke-miterlimit:10;" d="M 546.667969 160 L 550 160 "/>
<path style="fill:none;stroke-width:0.25;stroke-linecap:butt;stroke-linejoin:miter;stroke:rgb(72.2%25,52.5%25,4.3%25);stroke-opacity:1;stroke-miterlimit:10;" d="M 546.667969 155 L 550 155 "/>
<path style="fill:none;stroke-width:0.25;stroke-linecap:butt;stroke-linejoin:miter;stroke:rgb(72.2%25,52.5%25,4.3%25);stroke-opacity:1;stroke-miterlimit:10;" d="M 546.667969 150 L 550 150 "/>
<path style="fill:none;stroke-width:0.25;stroke-linecap:butt;stroke-linejoin:miter;stroke:rgb(72.2%25,52.5%25,4.3%25);stroke-opacity:1;stroke-miterlimit:10;" d="M 546.667969 145 L 550 145 "/>
<path style="fill:none;stroke-width:0.25;stroke-linecap:butt;stroke-linejoin:miter;stroke:rgb(72.2%25,52.5%25,4.3%25);stroke-opacity:1;stroke-miterlimit:10;" d="M 546.667969 140 L 550 140 "/>
<path style="fill:none;stroke-width:0.25;stroke-linecap:butt;stroke-linejoin:miter;stroke:rgb(72.2%25,52.5%25,4.3%25);stroke-opacity:1;stroke-miterlimit:10;" d="M 546.667969 135 L 550 135 "/>
<path style="fill:none;stroke-width:0.25;stroke-linecap:butt;stroke-linejoin:miter;stroke:rgb(72.2%25,52.5%25,4.3%25);stroke-opacity:1;stroke-miterlimit:10;" d="M 546.667969 130 L 550 130 "/>
<path style="fill:none;stroke-width:0.25;stroke-linecap:butt;stroke-linejoin:miter;stroke:rgb(72.2%25,52.5%25,4.3%25);stroke-opacity:1;stroke-miterlimit:10;" d="M 546.667969 125 L 550 125 "/>
<path style="fill:none;stroke-width:0.25;stroke-linecap:butt;stroke-linejoin:miter;stroke:rgb(72.2%25,52.5%25,4.3%25);stroke-opacity:1;stroke-miterlimit:10;" d="M 546.667969 120 L 550 120 "/>
<path style="fill:none;stroke-width:0.25;stroke-linecap:butt;stroke-linejoin:miter;stroke:rgb(72.2%25,52.5%25,4.3%25);stroke-opacity:1;stroke-miterlimit:10;" d="M 546.667969 115 L 550 115 "/>
<path style="fill:none;stroke-width:0.25;stroke-linecap:butt;stroke-linejoin:miter;stroke:rgb(72.2%25,52.5%25,4.3%25);stroke-opacity:1;stroke-miterlimit:10;" d="M 546.667969 110 L 550 110 "/>
<path style="fill:none;stroke-width:0.25;stroke-linecap:butt;stroke-linejoin:miter;stroke:rgb(72.2%25,52.5%25,4.3%25);stroke-opacity:1;stroke-miterlimit:10;" d="M 546.667969 105 L 550 105 "/>
<path style="fill:none;stroke-width:0.25;stroke-linecap:butt;stroke-linejoin:miter;stroke:rgb(72.2%25,52.5%25,4.3%25);stroke-opacity:1;stroke-miterlimit:10;" d="M 546.667969 100 L 550 100 "/>
<path style="fill:none;stroke-width:0.25;stroke-linecap:butt;stroke-linejoin:miter;stroke:rgb(72.2%25,52.5%25,4.3%25);stroke-opacity:1;stroke-miterlimit:10;" d="M 546.667969 95 L 550 95 "/>
<path style="fill:none;stroke-width:0.25;stroke-linecap:butt;stroke-linejoin:miter;stroke:rgb(72.2%25,52.5%25,4.3%25);stroke-opacity:1;stroke-miterlimit:10;" d="M 546.667969 90 L 550 90 "/>
<path style="fill:none;stroke-width:0.25;stroke-linecap:butt;stroke-linejoin:miter;stroke:rgb(72.2%25,52.5%25,4.3%25);stroke-opacity:1;stroke-miterlimit:10;" d="M 546.667969 85 L 550 85 "/>
<path style="fill:none;stroke-width:0.25;stroke-linecap:butt;stroke-linejoin:miter;stroke:rgb(72.2%25,52.5%25,4.3%25);stroke-opacity:1;stroke-miterlimit:10;" d="M 546.667969 80 L 550 80 "/>
<path style="fill:none;stroke-width:0.25;stroke-linecap:butt;stroke-linejoin:miter;stroke:rgb(72.2%25,52.5%25,4.3%25);stroke-opacity:1;stroke-miterlimit:10;" d="M 546.667969 75 L 550 75 "/>
<path style="fill:none;stroke-width:0.25;stroke-linecap:butt;stroke-linejoin:miter;stroke:rgb(72.2%25,52.5%25,4.3%25);stroke-opacity:1;stroke-miterlimit:10;" d="M 546.667969 70 L 550 70 "/>
<path style="fill:none;stroke-width:0.25;stroke-linecap:butt;stroke-linejoin:miter;stroke:rgb(72.2%25,52.5%25,4.3%25);stroke-opacity:1;stroke-miterlimit:10;" d="M 546.667969 65 L 550 65 "/>
<path style="fill:none;stroke-width:0.25;stroke-linecap:butt;stroke-linejoin:miter;stroke:rgb(72.2%25,52.5%25,4.3%25);stroke-opacity:1;stroke-miterlimit:10;" d="M 546.667969 60 L 550 60 "/>
<path style="fill:none;stroke-width:0.25;stroke-linecap:butt;stroke-linejoin:miter;stroke:rgb(72.2%25,52.5%25,4.3%25);stroke-opacity:1;stroke-miterlimit:10;" d="M 546.667969 55 L 550 55 "/>
<path style="fill:none;stroke-width:0.25;stroke-linecap:butt;stroke-linejoin:miter;stroke:rgb(72.2%25,52.5%25,4.3%25);stroke-opacity:1;stroke-miterlimit:10;" d="M 546.667969 50 L 550 50 "/>
<path style="fill:none;stroke-width:0.25;stroke-linecap:butt;stroke-linejoin:miter;stroke:rgb(72.2%25,52.5%25,4.3%25);stroke-opacity:1;stroke-miterlimit:10;" d="M 546.667969 45 L 550 45 "/>
<path style="fill:none;stroke-width:0.25;stroke-linecap:butt;stroke-linejoin:miter;stroke:rgb(72.2%25,52.5%25,4.3%25);stroke-opacity:1;stroke-miterlimit:10;" d="M 546.667969 40 L 550 40 "/>
<path style="fill:none;stroke-width:0.25;stroke-linecap:butt;stroke-linejoin:miter;stroke:rgb(72.2%25,52.5%25,4.3%25);stroke-opacity:1;stroke-miterlimit:10;" d="M 546.667969 35 L 550 35 "/>
<path style="fill:none;stroke-width:0.25;stroke-linecap:butt;stroke-linejoin:miter;stroke:rgb(72.2%25,52.5%25,4.3%25);stroke-opacity:1;stroke-miterlimit:10;" d="M 546.667969 30 L 550 30 "/>
<path style="fill:none;stroke-width:0.25;stroke-linecap:butt;stroke-linejoin:miter;stroke:rgb(72.2%25,52.5%25,4.3%25);stroke-opacity:1;stroke-miterlimit:10;" d="M 546.667969 25 L 550 25 "/>
<g style="fill:rgb(72.2%25,52.5%25,4.3%25);fill-opacity:1;">
<use xlink:href="%23glyph-1829024-1" x="557.738" y="231.666667"/>
<use xlink:href="%23glyph-1829024-2" x="558.898" y="231.666667"/>
</g>
<g style="fill:rgb(72.2%25,52.5%25,4.3%25);fill-opacity:1;">
<use xlink:href="%23glyph-1829024-3" x="567.738" y="231.666667"/>
<use xlink:href="%23glyph-1829024-2" x="568.898" y="231.666667"/>
</g>
<g style="fill:rgb(72.2%25,52.5%25,4.3%25);fill-opacity:1;">
<use xlink:href="%23glyph-1829024-4" x="577.738" y="231.666667"/>
<use xlink:href="%23glyph-1829024-2" x="578.898" y="231.666667"/>
</g>
<g style="fill:rgb(72.2%25,52.5%25,4.3%25);fill-opacity:1;">
<use xlink:href="%23glyph-1829024-5" x="587.738" y="231.666667"/>
<use xlink:href="%23glyph-1829024-2" x="588.898" y="231.666667"/>
</g>
<g style="fill:rgb(72.2%25,52.5%25,4.3%25);fill-opacity:1;">
<use xlink:href="%23glyph-1829024-6" x="597.738" y="231.666667"/>
<use xlink:href="%23glyph-1829024-2" x="598.898" y="231.666667"/>
</g>
<g style="fill:rgb(72.2%25,52.5%25,4.3%25);fill-opacity:1;">
<use xlink:href="%23glyph-1829024-7" x="607.738" y="231.666667"/>
<use xlink:href="%23glyph-1829024-2" x="608.898" y="231.666667"/>
</g>
<g style="fill:rgb(72.2%25,52.5%25,4.3%25);fill-opacity:1;">
<use xlink:href="%23glyph-1829024-8" x="617.738" y="231.666667"/>
<use xlink:href="%23glyph-1829024-2" x="618.898" y="231.666667"/>
</g>
<g style="fill:rgb(72.2%25,52.5%25,4.3%25);fill-opacity:1;">
<use xlink:href="%23glyph-1829024-9" x="627.738" y="231.666667"/>
<use xlink:href="%23glyph-1829024-2" x="628.898" y="231.666667"/>
</g>
<g style="fill:rgb(72.2%25,52.5%25,4.3%25);fill-opacity:1;">
<use xlink:href="%23glyph-1829024-10" x="637.738" y="231.666667"/>
<use xlink:href="%23glyph-1829024-2" x="638.898" y="231.666667"/>
</g>
<g style="fill:rgb(72.2%25,52.5%25,4.3%25);fill-opacity:1;">
<use xlink:href="%23glyph-1829024-1" x="646.578" y="231.666667"/>
<use xlink:href="%23glyph-1829024-2" x="647.738" y="231.666667"/>
<use xlink:href="%23glyph-1829024-2" x="648.898" y="231.666667"/>
</g>
<g style="fill:rgb(72.2%25,52.5%25,4.3%25);fill-opacity:1;">
<use xlink:href="%23glyph-1829024-1" x="656.578" y="231.666667"/>
<use xlink:href="%23glyph-1829024-1" x="657.738" y="231.666667"/>
<use xlink:href="%23glyph-1829024-2" x="658.898" y="231.666667"/>
</g>
<g style="fill:rgb(72.2%25,52.5%25,4.3%25);fill-opacity:1;">
<use xlink:href="%23glyph-1829024-1" x="666.578" y="231.666667"/>
<use xlink:href="%23glyph-1829024-3" x="667.738" y="231.666667"/>
<use xlink:href="%23glyph-1829024-2" x="668.898" y="231.666667"/>
</g>
<g style="fill:rgb(72.2%25,52.5%25,4.3%25);fill-opacity:1;">
<use xlink:href="%23glyph-1829024-1" x="676.578" y="231.666667"/>
<use xlink:href="%23glyph-1829024-4" x="677.738" y="231.666667"/>
<use xlink:href="%23glyph-1829024-2" x="678.898" y="231.666667"/>
</g>
<g style="fill:rgb(72.2%25,52.5%25,4.3%25);fill-opacity:1;">
<use xlink:href="%23glyph-1829024-1" x="686.578" y="231.666667"/>
<use xlink:href="%23glyph-1829024-5" x="687.738" y="231.666667"/>
<use xlink:href="%23glyph-1829024-2" x="688.898" y="231.666667"/>
</g>
<g style="fill:rgb(72.2%25,52.5%25,4.3%25);fill-opacity:1;">
<use xlink:href="%23glyph-1829024-1" x="696.578" y="231.666667"/>
<use xlink:href="%23glyph-1829024-6" x="697.738" y="231.666667"/>
<use xlink:href="%23glyph-1829024-2" x="698.898" y="231.666667"/>
</g>
<g style="fill:rgb(72.2%25,52.5%25,4.3%25);fill-opacity:1;">
<use xlink:href="%23glyph-1829024-1" x="706.578" y="231.666667"/>
<use xlink:href="%23glyph-1829024-7" x="707.738" y="231.666667"/>
<use xlink:href="%23glyph-1829024-2" x="708.898" y="231.666667"/>
</g>
<g style="fill:rgb(72.2%25,52.5%25,4.3%25);fill-opacity:1;">
<use xlink:href="%23glyph-1829024-1" x="716.578" y="231.666667"/>
<use xlink:href="%23glyph-1829024-8" x="717.738" y="231.666667"/>
<use xlink:href="%23glyph-1829024-2" x="718.898" y="231.666667"/>
</g>
<g style="fill:rgb(72.2%25,52.5%25,4.3%25);fill-opacity:1;">
<use xlink:href="%23glyph-1829024-1" x="726.578" y="231.666667"/>
<use xlink:href="%23glyph-1829024-9" x="727.738" y="231.666667"/>
<use xlink:href="%23glyph-1829024-2" x="728.898" y="231.666667"/>
</g>
<g style="fill:rgb(72.2%25,52.5%25,4.3%25);fill-opacity:1;">
<use xlink:href="%23glyph-1829024-1" x="736.578" y="231.666667"/>
<use xlink:href="%23glyph-1829024-10" x="737.738" y="231.666667"/>
<use xlink:href="%23glyph-1829024-2" x="738.898" y="231.666667"/>
</g>
<g style="fill:rgb(72.2%25,52.5%25,4.3%25);fill-opacity:1;">
<use xlink:href="%23glyph-1829024-3" x="746.578" y="231.666667"/>
<use xlink:href="%23glyph-1829024-2" x="747.738" y="231.666667"/>
<use xlink:href="%23glyph-1829024-2" x="748.898" y="231.666667"/>
</g>
<g style="fill:rgb(72.2%25,52.5%25,4.3%25);fill-opacity:1;">
<use xlink:href="%23glyph-1829025-1" x="543.333333" y="217.262"/>
<use xlink:href="%23glyph-1829025-2" x="543.333333" y="216.102"/>
</g>
<g style="fill:rgb(72.2%25,52.5%25,4.3%25);fill-opacity:1;">
<use xlink:href="%23glyph-1829025-3" x="543.333333" y="207.262"/>
<use xlink:href="%23glyph-1829025-2" x="543.333333" y="206.102"/>
</g>
<g style="fill:rgb(72.2%25,52.5%25,4.3%25);fill-opacity:1;">
<use xlink:href="%23glyph-1829025-4" x="543.333333" y="197.262"/>
<use xlink:href="%23glyph-1829025-2" x="543.333333" y="196.102"/>
</g>
<g style="fill:rgb(72.2%25,52.5%25,4.3%25);fill-opacity:1;">
<use xlink:href="%23glyph-1829025-5" x="543.333333" y="187.262"/>
<use xlink:href="%23glyph-1829025-2" x="543.333333" y="186.102"/>
</g>
<g style="fill:rgb(72.2%25,52.5%25,4.3%25);fill-opacity:1;">
<use xlink:href="%23glyph-1829025-6" x="543.333333" y="177.262"/>
<use xlink:href="%23glyph-1829025-2" x="543.333333" y="176.102"/>
</g>
<g style="fill:rgb(72.2%25,52.5%25,4.3%25);fill-opacity:1;">
<use xlink:href="%23glyph-1829025-7" x="543.333333" y="167.262"/>
<use xlink:href="%23glyph-1829025-2" x="543.333333" y="166.102"/>
</g>
<g style="fill:rgb(72.2%25,52.5%25,4.3%25);fill-opacity:1;">
<use xlink:href="%23glyph-1829025-8" x="543.333333" y="157.262"/>
<use xlink:href="%23glyph-1829025-2" x="543.333333" y="156.102"/>
</g>
<g style="fill:rgb(72.2%25,52.5%25,4.3%25);fill-opacity:1;">
<use xlink:href="%23glyph-1829025-9" x="543.333333" y="147.262"/>
<use xlink:href="%23glyph-1829025-2" x="543.333333" y="146.102"/>
</g>
<g style="fill:rgb(72.2%25,52.5%25,4.3%25);fill-opacity:1;">
<use xlink:href="%23glyph-1829025-10" x="543.333333" y="137.262"/>
<use xlink:href="%23glyph-1829025-2" x="543.333333" y="136.102"/>
</g>
<g style="fill:rgb(72.2%25,52.5%25,4.3%25);fill-opacity:1;">
<use xlink:href="%23glyph-1829025-1" x="543.333333" y="128.422"/>
<use xlink:href="%23glyph-1829025-2" x="543.333333" y="127.262"/>
<use xlink:href="%23glyph-1829025-2" x="543.333333" y="126.102"/>
</g>
<g style="fill:rgb(72.2%25,52.5%25,4.3%25);fill-opacity:1;">
<use xlink:href="%23glyph-1829025-1" x="543.333333" y="118.422"/>
<use xlink:href="%23glyph-1829025-1" x="543.333333" y="117.262"/>
<use xlink:href="%23glyph-1829025-2" x="543.333333" y="116.102"/>
</g>
<g style="fill:rgb(72.2%25,52.5%25,4.3%25);fill-opacity:1;">
<use xlink:href="%23glyph-1829025-1" x="543.333333" y="108.422"/>
<use xlink:href="%23glyph-1829025-3" x="543.333333" y="107.262"/>
<use xlink:href="%23glyph-1829025-2" x="543.333333" y="106.102"/>
</g>
<g style="fill:rgb(72.2%25,52.5%25,4.3%25);fill-opacity:1;">
<use xlink:href="%23glyph-1829025-1" x="543.333333" y="98.422"/>
<use xlink:href="%23glyph-1829025-4" x="543.333333" y="97.262"/>
<use xlink:href="%23glyph-1829025-2" x="543.333333" y="96.102"/>
</g>
<g style="fill:rgb(72.2%25,52.5%25,4.3%25);fill-opacity:1;">
<use xlink:href="%23glyph-1829025-1" x="543.333333" y="88.422"/>
<use xlink:href="%23glyph-1829025-5" x="543.333333" y="87.262"/>
<use xlink:href="%23glyph-1829025-2" x="543.333333" y="86.102"/>
</g>
<g style="fill:rgb(72.2%25,52.5%25,4.3%25);fill-opacity:1;">
<use xlink:href="%23glyph-1829025-1" x="543.333333" y="78.422"/>
<use xlink:href="%23glyph-1829025-6" x="543.333333" y="77.262"/>
<use xlink:href="%23glyph-1829025-2" x="543.333333" y="76.102"/>
</g>
<g style="fill:rgb(72.2%25,52.5%25,4.3%25);fill-opacity:1;">
<use xlink:href="%23glyph-1829025-1" x="543.333333" y="68.422"/>
<use xlink:href="%23glyph-1829025-7" x="543.333333" y="67.262"/>
<use xlink:href="%23glyph-1829025-2" x="543.333333" y="66.102"/>
</g>
<g style="fill:rgb(72.2%25,52.5%25,4.3%25);fill-opacity:1;">
<use xlink:href="%23glyph-1829025-1" x="543.333333" y="58.422"/>
<use xlink:href="%23glyph-1829025-8" x="543.333333" y="57.262"/>
<use xlink:href="%23glyph-1829025-2" x="543.333333" y="56.102"/>
</g>
<g style="fill:rgb(72.2%25,52.5%25,4.3%25);fill-opacity:1;">
<use xlink:href="%23glyph-1829025-1" x="543.333333" y="48.422"/>
<use xlink:href="%23glyph-1829025-9" x="543.333333" y="47.262"/>
<use xlink:href="%23glyph-1829025-2" x="543.333333" y="46.102"/>
</g>
<g style="fill:rgb(72.2%25,52.5%25,4.3%25);fill-opacity:1;">
<use xlink:href="%23glyph-1829025-1" x="543.333333" y="38.422"/>
<use xlink:href="%23glyph-1829025-10" x="543.333333" y="37.262"/>
<use xlink:href="%23glyph-1829025-2" x="543.333333" y="36.102"/>
</g>
<g style="fill:rgb(72.2%25,52.5%25,4.3%25);fill-opacity:1;">
<use xlink:href="%23glyph-1829025-3" x="543.333333" y="28.422"/>
<use xlink:href="%23glyph-1829025-2" x="543.333333" y="27.262"/>
<use xlink:href="%23glyph-1829025-2" x="543.333333" y="26.102"/>
</g>
<g style="fill:rgb(72.2%25,52.5%25,4.3%25);fill-opacity:1;">
<use xlink:href="%23glyph-1829026-1" x="730.355" y="199.61875"/>
</g>
<g style="fill:rgb(72.2%25,52.5%25,4.3%25);fill-opacity:1;">
<use xlink:href="%23glyph-1829027-1" x="514.61875" y="54.4275"/>
</g>
<g style="fill:rgb(100%25,100%25,100%25);fill-opacity:1;">
<use xlink:href="%23glyph-1829026-1" x="560.355" y="229.61875"/>
</g>
<g style="fill:rgb(100%25,100%25,100%25);fill-opacity:1;">
<use xlink:href="%23glyph-1829027-1" x="537.952083" y="227.760833"/>
</g>
<path style="fill:none;stroke-width:0.25;stroke-linecap:butt;stroke-linejoin:miter;stroke:rgb(100%25,100%25,100%25);stroke-opacity:1;stroke-miterlimit:10;" d="M 552 225 C 552 223.894531 551.105469 223 550 223 C 548.894531 223 548 223.894531 548 225 C 548 226.105469 548.894531 227 550 227 C 551.105469 227 552 226.105469 552 225 Z M 552 225 "/>
<path style=" stroke:none;fill-rule:nonzero;fill:rgb(100%25,100%25,100%25);fill-opacity:0.5;" d="M 552 225 C 552 223.894531 551.105469 223 550 223 C 548.894531 223 548 223.894531 548 225 C 548 226.105469 548.894531 227 550 227 C 551.105469 227 552 226.105469 552 225 Z M 552 225 "/>
</g>
</svg>)
If you do this and try to place text, all your text will be incorrectly drawn upside down, so you'd need to enclose any text placement with another matrix transformation.
Advanced transformations
For more powerful transformations of graphic elements, consider using Julia packages which are designed specifically for the purpose.
The following example uses the Rotations and CoordinateTransformations packages. It sets up some transformations which can then be composed in the correct order to transform points.
using CoordinateTransformations, Rotations, StaticArrays, LinearAlgebra

rawpts = [
    [0.1, 0.1],
    [0.1, -0.1],
    [-0.1, -0.1],
    [-0.1, 0.1]
]

function transform_point(pt, transformation)
    x, y, _ = transformation(SVector(pt[1], pt[2], 1.0))
    return Point(x, y)
end

𝕊1 = LinearMap(UniformScaling(60))
𝕋1 = Translation(20, 30, 0)
ℝ1 = LinearMap(RotZ(π/3))
pts = map(pt -> transform_point(pt, 𝕋1 ∘ ℝ1 ∘ 𝕊1), rawpts)
...