Basics
ColorScheme objects
When you start using ColorSchemes, it loads a set of pre-defined ColorSchemes in a dictionary called colorschemes.
A ColorScheme is a Julia object which contains:
- an ordered array of colors (see Colors.jl)
- a string defining a category
- a string containing descriptive notes
To access one of the built-in colorschemes, use its symbol:
ColorSchemes.leonardo
or
colorschemes[:leonardo]The display depends on your working environment. If you’re using a notebook or IDE environment, the colors in the colorscheme should appear as a swatch in a cell or in a Plots window. Otherwise, you’ll see the colors listed as RGB values:
32-element Array{RGB{Float64},1}:
 RGB{Float64}(0.0548203,0.016509,0.0193152)
 RGB{Float64}(0.0750816,0.0341102,0.0397083)
 RGB{Float64}(0.10885,0.0336675,0.0261204)
 RGB{Float64}(0.100251,0.0534243,0.0497594)
 ...
 RGB{Float64}(0.620187,0.522792,0.216707)
 RGB{Float64}(0.692905,0.56631,0.185515)
 RGB{Float64}(0.681411,0.58149,0.270391)
 RGB{Float64}(0.85004,0.540122,0.136212)
 RGB{Float64}(0.757552,0.633425,0.251451)
 RGB{Float64}(0.816472,0.697015,0.322421)
 RGB{Float64}(0.933027,0.665164,0.198652)
 RGB{Float64}(0.972441,0.790701,0.285136)
You can access the array of colors as:
ColorSchemes.leonardo.colorsBy default, the names of the built-in colorschemes aren’t imported. You can import the ones that you want:
julia> import ColorSchemes.leonardo
julia> leonardo
32-element Array{RGB{Float64},1}:
 RGB{Float64}(0.0548203,0.016509,0.0193152)
 RGB{Float64}(0.0750816,0.0341102,0.0397083)
 RGB{Float64}(0.10885,0.0336675,0.0261204)
 RGB{Float64}(0.100251,0.0534243,0.0497594)
 ...
 RGB{Float64}(0.757552,0.633425,0.251451)
 RGB{Float64}(0.816472,0.697015,0.322421)
 RGB{Float64}(0.933027,0.665164,0.198652)
 RGB{Float64}(0.972441,0.790701,0.285136)
You can reference a single color in a scheme:
leonardo[3]

-> RGB{Float64}(0.10884977211887092,0.033667530751245296,0.026120424375656533)
Or you can ‘sample’ the scheme at any point between 0 and 1 using get or getindex:
get(leonardo, 0.5)

-> RGB{Float64}(0.42637271063618504,0.28028983973265065,0.11258024276603132)

leonardo[0.5]

-> RGB{Float64}(0.42637271063618504,0.28028983973265065,0.11258024276603132)
With get you can resample an existing colorscheme, by passing a range:
get(ColorSchemes.darkrainbow, range(0.0, 1.0, length=14))

-> RGB{Float64}[
      RGB{Float64}(0.237736, 0.340215, 0.575113),
      RGB{Float64}(0.249978, 0.343813, 0.5620657),
      RGB{Float64}(0.259452, 0.386963, 0.464862),
      RGB{Float64}(0.272746, 0.439684, 0.3499807),
      ...
      RGB{Float64}(0.72987,0.239399,0.230961),
      RGB{Float64}(0.72987,0.239399,0.230961)]
and you can make a new scheme from this:
ndr = ColorScheme(get(ColorSchemes.darkrainbow, range(0.0, 1.0, length=14)))
See below for more possibilities.
The colorschemes dictionary
The ColorSchemes module automatically provides a number of predefined schemes. All the colorschemes are stored in an exported dictionary, called colorschemes.
colorschemes[:summer] |> show
    ColorScheme(
        ColorTypes.RGB{Float64}[
            RGB{Float64}(0.0,0.5,0.4),
            RGB{Float64}(0.01,0.505,0.4),
            RGB{Float64}(0.02,0.51,0.4),
            RGB{Float64}(0.03,0.515,0.4),
            ...
            RGB{Float64}(1.0,1.0,0.4)],
       "matplotlib",
       "sampled color schemes, sequential linearly-increasing shades of green-yellow")
Finding colorschemes
Use the findcolorscheme function to search through the pre-defined colorschemes. The string you provide can occur in the colorscheme’s name, in the category, or (optionally) in the notes. It’s interpreted as a case-insensitive regular expression.
julia> findcolorscheme("ice")

colorschemes containing "ice"

  seaborn_icefire_gradient
  seaborn_icefire_gradient  (notes) sequential, ice fire gradient...
  ice
  flag_is                   (notes) The flag of Iceland...
  botticelli
  botticelli                (notes) palette from artist Sandro Bot...


 ...found 6 results for "ice"
The function returns a list of matching colorscheme names as symbols.
ColorSchemes.findcolorscheme — Function
findcolorscheme(str;
    search_notes=true)
Find all colorschemes matching str. str is interpreted as a regular expression (case-insensitive).
This returns an array of symbols which are the names of matching schemes in the colorschemes dictionary.
julia> findcolorscheme("ice")

colorschemes containing "ice"

  seaborn_icefire_gradient
  seaborn_icefire_gradient  (notes) sequential, ice fire gradient...
  ice
  flag_is               (notes) The flag of Iceland...
  botticelli
  botticelli            (notes) palette from artist Sandro Bot...


 ...found 6 results for "ice"
To read the notes of a built-in colorscheme cscheme:
colorschemes[:cscheme].notesIf you prefer, you can ‘roll your own’ search.
[k for (k, v) in ColorSchemes.colorschemes if occursin(r"colorbrew"i, v.category)]
265-element Array{Symbol,1}:
 :BuPu_6
 :Spectral_4
 :RdYlGn_5
 ⋮
 :BrBG_8
 :Oranges_4
Make your own colorscheme
Using Colors.jl, you can use the ColorScheme constructor to make a range of colors into a colorscheme.
Using Colors.jl's range():
cs1 = ColorScheme(range(colorant"red", colorant"green", length=5))
Using get():
cs1 = ColorScheme(get(ColorSchemes.darkrainbow, range(0.3, 0.7, length=10)))
Converting from a sequential palette:
cs1 = ColorScheme(reverse(Colors.sequential_palette(300, 100, logscale=true)))
From an array comprehension:
mygrays = ColorScheme([RGB{Float64}(i, i, i) for i in 0:0.1:1.0])
A logarithmic scheme:
ColorScheme(get(ColorSchemes.darkrainbow, 10 .^ range(-2, stop=0, length=50)))
Give it a category or some added notes if you want:
mygrays = ColorScheme([RGB{Float64}(i, i, i) for i in 0:0.1:1.0],
    "my useful schemes", "just some dull grey shades")
although this scheme won’t be stored in the supplied colorschemes dictionary.
Another example: start with a two-color scheme, then building a gradient from the first color to the other.
myscheme = ColorScheme([Colors.RGB(1.0, 0.0, 0.0), Colors.RGB(0.0, 1.0, 0.0)],
               "custom", "twotone, red and green")
ColorScheme([get(myscheme, i) for i in 0.0:0.01:1.0])
Another way is to use the loadcolorscheme function used to build the colorschemes dictionary when the package is loaded:
using Colors, ColorSchemes
loadcolorscheme(:mygrays, [RGB{Float64}(i, i, i) for i in 0:0.1:1.0],
     "useful schemes", "just some dull grey shades")
and that will be added (temporarily) to the built-in dictionary.
julia> findcolorscheme("dull")

colorschemes containing "dull"

  mygrays               (notes) just some dull grey shades...


...found 1 result for "dull"If you want to make more advanced ColorSchemes, use linear-segment dictionaries or indexed lists, and use functions to generate color values, see the make_colorscheme() function in the ColorSchemeTools.jl package.
For CVD (color-vision deficient or "color-blind") users
This package contains a number of colorschemes that are designed to be helpful for people with some deficiencies in their perception of color:
deuteranomaly (where green looks more red)
protanomaly (where red looks more green and less bright)
tritanomaly (difficult to tell the difference between blue and green, and between yellow and red)
tritanopia (difficult to tell the difference between blue and green, purple and red, and yellow and pink)
findcolorscheme("cvd")

colorschemes containing "cvd"

  tol_light            (category) cvd
  tol_muted            (category) cvd
  tol_bright           (category) cvd
  okabe_ito            (category) cvd
  mk_8                 (category) cvd
  mk_12                (category) cvd
  mk_15                (category) cvd
:tol_light

:tol_muted

:tol_bright

:okabe_ito

:mk_8

:mk_12

:mk_15

Also, it's possible to generate schemes using Colors.distinguishable_colors():
using Colors, ColorSchemes
ColorScheme(distinguishable_colors(10, transform=protanopic))
The resample() function
Use resample() to make a new colorscheme by resampling an existing one:
ColorSchemes.turbo
resample(ColorSchemes.turbo, 9)
You can pass a function to resample() to control the alpha opacity of each color in the color scheme.
resample(ColorSchemes.turbo, 9, (alpha) -> 0.5)" >
<path d="M.1,0h.1v.1h-.2v.1h.1z" fill="%23999" opacity=".5" />
</pattern>
</defs>
<rect width="9" height="1" fill="url(%23pat_2wIBZ4)" />
<path d="M1,.1V1h-1V.9z" fill="%2330123B" />
<path d="M0,0h1v1h-1z" fill="%2330123B" fill-opacity=".5" />
<path d="M2,.1V1h-1V.9z" fill="%23466BE3" />
<path d="M1,0h1v1h-1z" fill="%23466BE3" fill-opacity=".5" />
<path d="M3,.1V1h-1V.9z" fill="%2329BBEC" />
<path d="M2,0h1v1h-1z" fill="%2329BBEC" fill-opacity=".5" />
<path d="M4,.1V1h-1V.9z" fill="%2331F299" />
<path d="M3,0h1v1h-1z" fill="%2331F299" fill-opacity=".5" />
<path d="M5,.1V1h-1V.9z" fill="%23A3FD3C" />
<path d="M4,0h1v1h-1z" fill="%23A3FD3C" fill-opacity=".5" />
<path d="M6,.1V1h-1V.9z" fill="%23EDD03A" />
<path d="M5,0h1v1h-1z" fill="%23EDD03A" fill-opacity=".5" />
<path d="M7,.1V1h-1V.9z" fill="%23FB8022" />
<path d="M6,0h1v1h-1z" fill="%23FB8022" fill-opacity=".5" />
<path d="M8,.1V1h-1V.9z" fill="%23D23105" />
<path d="M7,0h1v1h-1z" fill="%23D23105" fill-opacity=".5" />
<path d="M9,.1V1h-1V.9z" fill="%237A0403" />
<path d="M8,0h1v1h-1z" fill="%237A0403" fill-opacity=".5" />
</svg>)
This sets the alpha value of every color to 0.5.
resample(ColorSchemes.turbo, 30, (alpha) -> sin(alpha * π))" >
<path d="M.1,0h.1v.1h-.2v.1h.1z" fill="%23999" opacity=".5" />
</pattern>
</defs>
<rect width="30" height="1" fill="url(%23pat_2IPckj)" />
<path d="M1,.38V1h-1V.62z" fill="%2330123B" />
<path d="M0,0h1v1h-1z" fill="%2330123B" fill-opacity="0" />
<path d="M2,.38V1h-1V.62z" fill="%233A2C78" />
<path d="M1,0h1v1h-1z" fill="%233A2C78" fill-opacity=".1081" />
<path d="M3,.38V1h-1V.62z" fill="%234145AA" />
<path d="M2,0h1v1h-1z" fill="%234145AA" fill-opacity=".215" />
<path d="M4,.38V1h-1V.62z" fill="%23455DD0" />
<path d="M3,0h1v1h-1z" fill="%23455DD0" fill-opacity=".3193" />
<path d="M5,.38V1h-1V.62z" fill="%234774EC" />
<path d="M4,0h1v1h-1z" fill="%234774EC" fill-opacity=".4199" />
<path d="M6,.38V1h-1V.62z" fill="%23458AFC" />
<path d="M5,0h1v1h-1z" fill="%23458AFC" fill-opacity=".5156" />
<path d="M7,.38V1h-1V.62z" fill="%233CA0FD" />
<path d="M6,0h1v1h-1z" fill="%233CA0FD" fill-opacity=".6052" />
<path d="M8,.38V1h-1V.62z" fill="%232DB6F1" />
<path d="M7,0h1v1h-1z" fill="%232DB6F1" fill-opacity=".6877" />
<path d="M9,.38V1h-1V.62z" fill="%231FCADC" />
<path d="M8,0h1v1h-1z" fill="%231FCADC" fill-opacity=".7622" />
<path d="M10,.38V1h-1V.62z" fill="%2318DBC5" />
<path d="M9,0h1v1h-1z" fill="%2318DBC5" fill-opacity=".8277" />
<path d="M11,.38V1h-1V.62z" fill="%231FE8AF" />
<path d="M10,0h1v1h-1z" fill="%231FE8AF" fill-opacity=".8835" />
<path d="M12,.38V1h-1V.62z" fill="%2334F395" />
<path d="M11,0h1v1h-1z" fill="%2334F395" fill-opacity=".929" />
<path d="M13,.38V1h-1V.62z" fill="%2354FA78" />
<path d="M12,0h1v1h-1z" fill="%2354FA78" fill-opacity=".9635" />
<path d="M14,.38V1h-1V.62z" fill="%2376FE5B" />
<path d="M13,0h1v1h-1z" fill="%2376FE5B" fill-opacity=".9868" />
<path d="M15,.38V1h-1V.62z" fill="%2396FE44" />
<path d="M14,0h1v1h-1z" fill="%2396FE44" fill-opacity=".9985" />
<path d="M16,.38V1h-1V.62z" fill="%23AEFA37" />
<path d="M15,0h1v1h-1z" fill="%23AEFA37" fill-opacity=".9985" />
<path d="M17,.38V1h-1V.62z" fill="%23C5F034" />
<path d="M16,0h1v1h-1z" fill="%23C5F034" fill-opacity=".9868" />
<path d="M18,.38V1h-1V.62z" fill="%23DAE336" />
<path d="M17,0h1v1h-1z" fill="%23DAE336" fill-opacity=".9635" />
<path d="M19,.38V1h-1V.62z" fill="%23EBD339" />
<path d="M18,0h1v1h-1z" fill="%23EBD339" fill-opacity=".929" />
<path d="M20,.38V1h-1V.62z" fill="%23F7C03A" />
<path d="M19,0h1v1h-1z" fill="%23F7C03A" fill-opacity=".8835" />
<path d="M21,.38V1h-1V.62z" fill="%23FDAC34" />
<path d="M20,0h1v1h-1z" fill="%23FDAC34" fill-opacity=".8277" />
<path d="M22,.38V1h-1V.62z" fill="%23FE942A" />
<path d="M21,0h1v1h-1z" fill="%23FE942A" fill-opacity=".7622" />
<path d="M23,.38V1h-1V.62z" fill="%23FA791F" />
<path d="M22,0h1v1h-1z" fill="%23FA791F" fill-opacity=".6877" />
<path d="M24,.38V1h-1V.62z" fill="%23F26014" />
<path d="M23,0h1v1h-1z" fill="%23F26014" fill-opacity=".6052" />
<path d="M25,.38V1h-1V.62z" fill="%23E7490B" />
<path d="M24,0h1v1h-1z" fill="%23E7490B" fill-opacity=".5156" />
<path d="M26,.38V1h-1V.62z" fill="%23D83706" />
<path d="M25,0h1v1h-1z" fill="%23D83706" fill-opacity=".4199" />
<path d="M27,.38V1h-1V.62z" fill="%23C62703" />
<path d="M26,0h1v1h-1z" fill="%23C62703" fill-opacity=".3193" />
<path d="M28,.38V1h-1V.62z" fill="%23B11901" />
<path d="M27,0h1v1h-1z" fill="%23B11901" fill-opacity=".215" />
<path d="M29,.38V1h-1V.62z" fill="%23970E01" />
<path d="M28,0h1v1h-1z" fill="%23970E01" fill-opacity=".1081" />
<path d="M30,.38V1h-1V.62z" fill="%237A0403" />
<path d="M29,0h1v1h-1z" fill="%237A0403" fill-opacity="0" />
</svg>)
This example varies the alpha from 0 (at 0.0), 1 (at 0.5), and 0 (at 1.0).
More about color sampling
You can access the specific colors of a colorscheme by indexing (eg leonardo[2] or leonardo[5:end]). Or you can sample a ColorScheme at a point between 0.0 and 1.0 as if it were a continuous range of colors:
get(leonardo, 0.5)returns
RGB{Float64}(0.42637271063618504,0.28028983973265065,0.11258024276603132)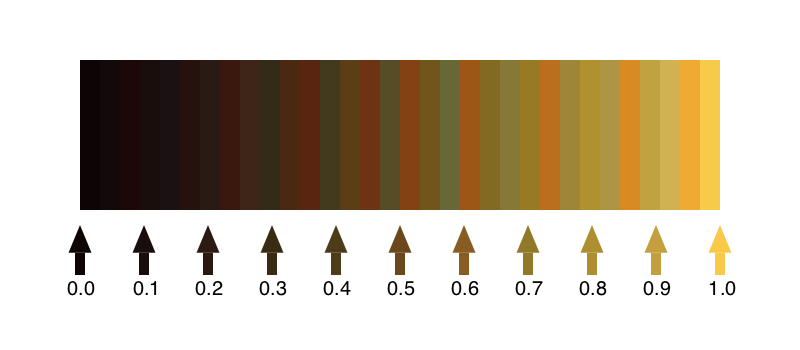
The colors in the predefined ColorSchemes are usually sorted by LUV luminance, so this often makes sense.
You can use get() with index data in arrays to return arrays of colors:
julia> get(leonardo, [0.0, 0.5, 1.0])
3-element Array{RGB{Float64},1} with eltype ColorTypes.RGB{Float64}:
 RGB{Float64}(0.05482025926320272,0.016508952654741622,0.019315160361063788)
 RGB{Float64}(0.42637271063618504,0.28028983973265065,0.11258024276603132)
 RGB{Float64}(0.9724409077178674,0.7907008712807734,0.2851364857083522)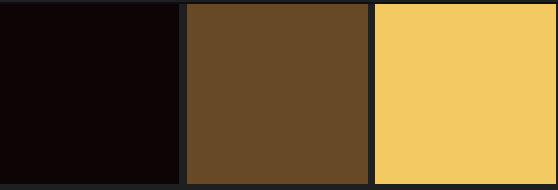
julia> simg = get(leonardo, rand(10, 16));
julia> using FileIO
julia> save("mosaic.png", simg)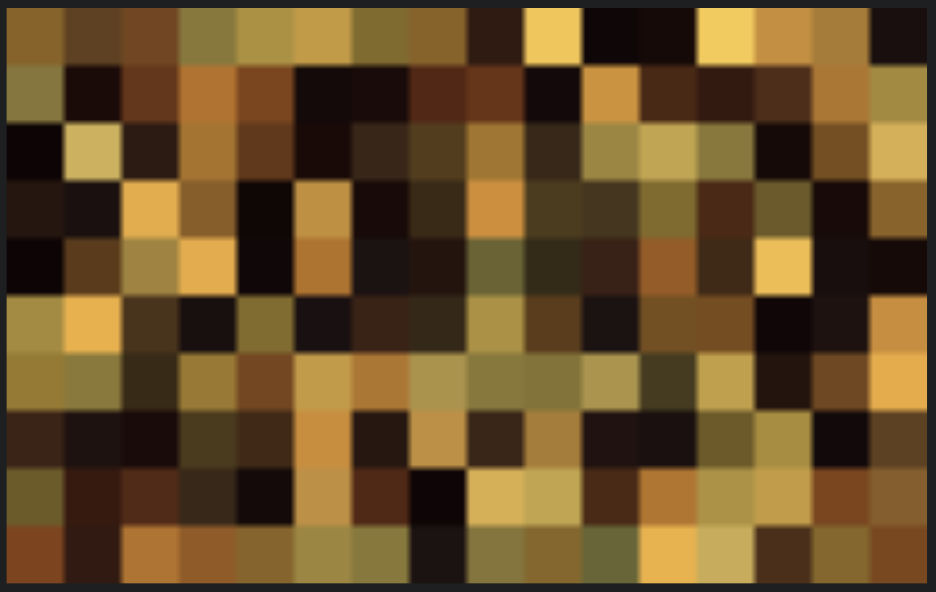
Matplotlib compatibility
Most of the color schemes in Matplotlib are available. The following code example gives a general picture.
using ColorSchemes

# https://matplotlib.org/examples/color/colormaps_reference.html

matplotlibcmaps = Dict(
   :perceptuallyuniformsequential => [
      :viridis, :plasma, :inferno, :magma],
   :sequential => [
      :Greys_9, :Purples_9, :Blues_9, :Greens_9, :Oranges_9, :Reds_9,
      :YlOrBr_9, :YlOrRd_9, :OrRd_9, :PuRd_9, :RdPu_9, :BuPu_9,
      :GnBu_9, :PuBu_9, :YlGnBu_9, :PuBuGn_9, :BuGn_9, :YlGn_9],
   :sequential2 => [
      :binary, :gist_yarg, :gist_gray, :gray, :bone, :pink,
      :spring, :summer, :autumn, :winter, :cool, :Wistia,
      :hot, :afmhot, :gist_heat, :copper],
   :diverging => [
      :PiYG_11, :PRGn_11, :BrBG_11, :PuOr_11, :RdGy_11, :RdBu_11,
      :RdYlBu_11, :RdYlGn_11, :Spectral_11, :coolwarm, :bwr, :seismic],
   :cyclical => [
        :twilight, :twilight_shifted, :hsv],
   :qualitative => [
      :Pastel1_9, :Pastel2_8, :Paired_11, :Accent_8,
      :Dark2_8, :Set1_9, :Set2_8, :Set3_12,
      :tab10, :tab20, :tab20b, :tab20c],
   :miscellaneous => [
      :flag, :prism, :ocean, :gist_earth, :terrain, :gist_stern,
      :gnuplot, :gnuplot2, :CMRmap, :cubehelix, :brg, :hsv,
      :gist_rainbow, :rainbow, :jet, :nipy_spectral, :gist_ncar]
   )

for (k, v) in matplotlibcmaps
   println("$(rpad(k, 12)) $(length(v))")
   for cs in v
      try
         c = ColorSchemes.colorschemes[cs]
      catch
         println("\t$(rpad(cs, 12)) not currently in stock")
      end
   end
end
cyclical 3
twilight_shifted not currently in stock
sequential 18
qualitative 12
sequential2 16
gray not currently in stock
perceptuallyuniformsequential 4
diverging 12
miscellaneous 17