More graphics
Julia logos
A couple of functions in Luxor provide you with instant access to the Julia logo, and the three colored circles:
for (pos, n) in Tiler(750, 250, 1, 2)
    gsave()
    translate(pos - Point(150, 100))
    if n == 1
        julialogo()
    elseif n == 2
        julialogo(action=:clip)
        for i in 1:500
            gsave()
            translate(rand(0:400), rand(0:250))
            juliacircles(10)
            grestore()
        end
        clipreset()
    end
    grestore()
end![]()
Luxor.julialogo — Function.julialogo(;action=:fill, color=true)Draw the Julia logo. The default action is to fill the logo and use the colors:
julialogo()If color is false, the logo will use the current color, and the dots won't be colored in the usual way.
The logo's dimensions are about 330 wide and 240 high, and the 0/0 point is at the bottom left corner. To place the logo by locating its center, do this:
gsave()
translate(-165, -120)
julialogo() # locate center at 0/0
grestore()
To use the logo as a clipping mask:
julialogo(action=:clip)(In this case the color setting is automatically ignored.)
Luxor.juliacircles — Function.juliacircles(radius=100)Draw the three Julia circles in color centered at the origin.
The distance of the centers of the circles from the origin is radius. The optional keyword arguments outercircleratio (default 0.75) and innercircleratio (default 0.65) control the radius of the individual colored circles relative to the radius. So you can get relatively smaller or larger circles by adjusting the ratios.
Hypotrochoids
hypotrochoid() makes hypotrochoids. The result is a polygon. You can either draw it directly, or pass it on for further polygon fun, as here, which uses offsetpoly() to trace round it a few times.
origin()
background("grey15")
sethue("antiquewhite")
setline(1)
p = hypotrochoid(100, 25, 55, :stroke, stepby=0.01, vertices=true)
for i in 0:3:15
    poly(offsetpoly(p, i), :stroke, close=true)
end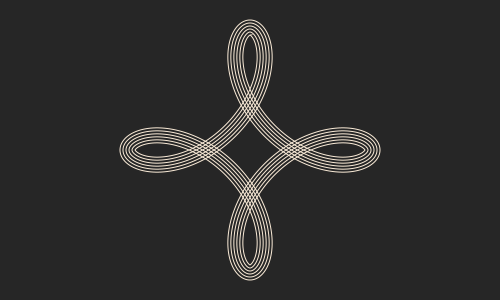
There's a matching epitrochoid() function.
Luxor.hypotrochoid — Function.hypotrochoid(R, r, d, action=:none;
stepby=0.01,
period=0,
vertices=false)Make a hypotrochoid with short line segments. (Like a Spirograph.) The curve is traced by a point attached to a circle of radius r rolling around the inside of a fixed circle of radius R, where the point is a distance d from the center of the interior circle. Things get interesting if you supply non-integral values.
Special cases include the hypocycloid, if d = r, and an ellipse, if R = 2r.
stepby, the angular step value, controls the amount of detail, ie the smoothness of the polygon,
If period is not supplied, or 0, the lowest period is calculated for you.
The function can return a polygon (a list of points), or draw the points directly using the supplied action. If the points are drawn, the function returns a tuple showing how many points were drawn and what the period was (as a multiple of pi).
Luxor.epitrochoid — Function.epitrochoid(R, r, d, action=:none;
stepby=0.01,
period=0,
vertices=false)Make a epitrochoid with short line segments. (Like a Spirograph.) The curve is traced by a point attached to a circle of radius r rolling around the outside of a fixed circle of radius R, where the point is a distance d from the center of the circle. Things get interesting if you supply non-integral values.
stepby, the angular step value, controls the amount of detail, ie the smoothness of the polygon.
If period is not supplied, or 0, the lowest period is calculated for you.
The function can return a polygon (a list of points), or draw the points directly using the supplied action. If the points are drawn, the function returns a tuple showing how many points were drawn and what the period was (as a multiple of pi).
Cropmarks
If you want cropmarks (aka trim marks), use the cropmarks() function, supplying the centerpoint, followed by the width and height:
cropmarks(O, 1200, 1600)
cropmarks(O, paper_sizes["A0"]...)
sethue("red")
box(O, 150, 150, :stroke)
cropmarks(O, 150, 150)
Luxor.cropmarks — Function.cropmarks(center, width, height)Draw cropmarks (also known as trim marks).
Bars
For simple bars, use the bars() function, supplying an array of numbers:
fontsize(7)
sethue("black")
v = rand(-100:100, 25)
bars(v)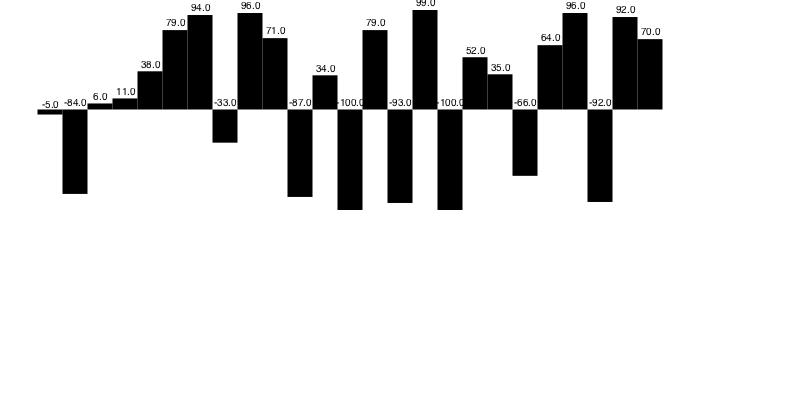
To change the way the bars and labels are drawn, define some functions and pass them as keyword arguments to bars():
function mybarfunction(low::Point, high::Point, value;
    extremes=[0, 1], barnumber=0, bartotal=0)
    @layer begin
        sethue(Colors.HSB(rescale(value, extremes[1], extremes[2], 0, 360), 1.0, 0.5))
        csize = rescale(value, extremes[1], extremes[2], 5, 25)
        circle(high, csize, :fill)
        setline(1)
        sethue("blue")
        line(Point(low.x, 0), high + (0, csize), :stroke)
        sethue("white")
        text(string(value), high, halign=:center, valign=:middle)
    end
end

function mylabelfunction(low::Point, high::Point, value;
    extremes=[0, 1], barnumber=0, bartotal=0)
    @layer begin
        translate(low)
        text(string(value), O + (0, 10), halign=:center, valign=:middle)
    end
end

v = rand(1:100, 25)
bars(v, xwidth=25, barfunction=mybarfunction, labelfunction=mylabelfunction)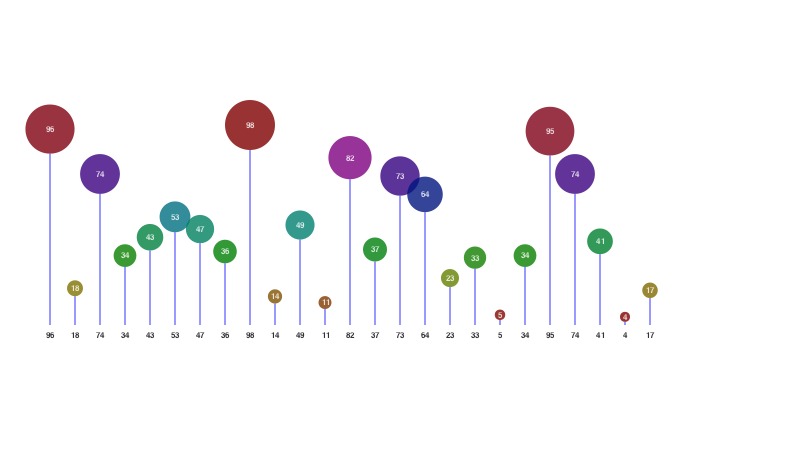
Luxor.bars — Function.bars(values::AbstractArray;
yheight = 200,
xwidth = 25,
labels = true,
barfunction = f,
labelfunction = f,
)Draw some bars where each bar is the height of a value in the array. The bars will fit in a box yheight high (even if there are negative values).
To control the drawing of the text and bars, define functions that process the end points:
mybarfunction(bottom::Point, top::Point, value; extremes=[a, b], barnumber=0, bartotal=0)
mylabelfunction(bottom::Point, top::Point, value; extremes=[a, b], barnumber=0, bartotal=0)
and pass them like this:
bars(v, yheight=10, xwidth=10, barfunction=mybarfunction)
bars(v, xwidth=15, yheight=10, labelfunction=mylabelfunction)
To suppress the text labels, use optional keyword labels=false.
Box maps
The boxmap() function divides a rectangular area into a sorted arrangement of smaller boxes or tiles based on the values of elements in an array.
This example uses the Fibonacci sequence to determine the area of the boxes. Notice that the values are sorted in reverse, and are scaled to fit in the available area.
fib = [1, 1, 2, 3, 5, 8, 13, 21, 34, 55, 89, 144]

# make a boxmap and store the tiles
tiles = boxmap(fib, BoundingBox()[1], 800, 450)

for (n, t) in enumerate(tiles)
    randomhue()
    bb = BoundingBox(t)
    sethue("black")
    box(bb - 5, :stroke)

    randomhue()
    box(bb - 8, :fill)

    # text labels
    sethue("white")

    # rescale text to fit better
    fontsize(boxwidth(bb) > boxheight(bb) ? boxheight(bb)/4 : boxwidth(bb)/4)
    text(string(sort(fib, rev=true)[n]),
        midpoint(bb[1], bb[2]),
        halign=:center,
            valign=:middle)
end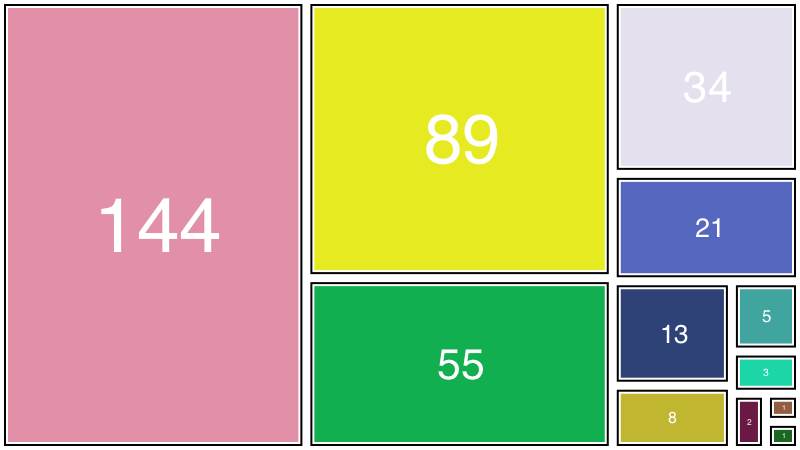
Luxor.boxmap — Function.boxmap(A::AbstractArray, pt, w, h)Build a box map of the values in A with one corner at pt and width w and height h. There are length(A) boxes. The areas of the boxes are proportional to the original values, scaled as necessary.
The return value is an array of BoxmapTiles. For example:
[BoxmapTile(0.0, 0.0, 10.0, 20.0)
 BoxmapTile(10.0, 0.0, 10.0, 13.3333)
 BoxmapTile(10.0, 13.3333, 10.0, 6.66667)]
with each tile containing (x, y, w, h). box() and BoundingBox() can work with BoxmapTiles as well.
Example
using Luxor
@svg begin
    fontsize(16)
    fontface("HelveticaBold")
    pt = Point(-200, -200)
    a = rand(10:200, 15)
    tiles = boxmap(a, Point(-200, -200), 400, 400)
     for (n, t) in enumerate(tiles)
        randomhue()
        bb = BoundingBox(t)
        box(bb - 2, :stroke)
        box(bb - 5, :fill)
        sethue("white")
        text(string(n), midpoint(bb[1], bb[2]), halign=:center)
    end
end 400 400 "/tmp/boxmap.svg"