Examples
The obligatory "Hello World"
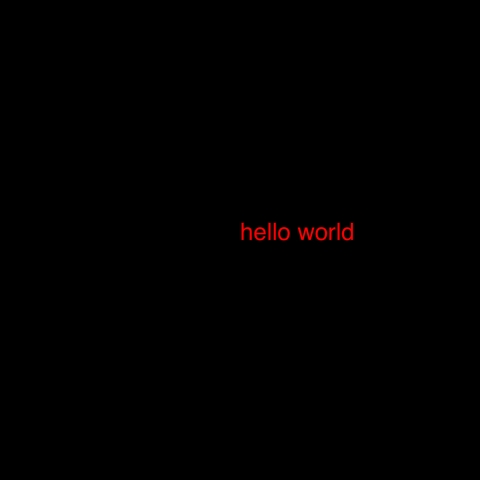
Here's the "Hello world":
using Luxor
Drawing(1000, 1000, "hello-world.png")
origin()
background("black")
sethue("red")
fontsize(50)
text("hello world")
finish()
preview()
The Drawing(1000, 1000, "hello-world.png") line defines the size of the image and the location and type of the finished image when it's saved. origin() moves the 0/0 point to the centre of the drawing surface (by default it's at the top left corner). Because we're using Colors.jl, we can specify colors by name: background("black") defines the color of the background of the drawing. text("helloworld") draws the text. It's placed at the current 0/0 if you don't specify otherwise. finish() completes the drawing and saves the image in the file. preview() tries to open the saved file using some other application (eg on MacOS X, Preview).
The Julia logos
Luxor contains two functions that draw the Julia logo, either in color or a single color, and the three Julia circles.
using Luxor
Drawing(600, 400, "assets/figures/julia-logos.png")
origin()
background("white")
for theta in range(0, pi/8, 16)
    gsave()
    scale(0.25, 0.25)
    rotate(theta)
    translate(250, 0)
    randomhue()
    julialogo(action=:fill, color=false)
    grestore()
end
gsave()
scale(0.3, 0.3)
juliacircles()
grestore()
translate(200, -150)
scale(0.3, 0.3)
julialogo()
finish()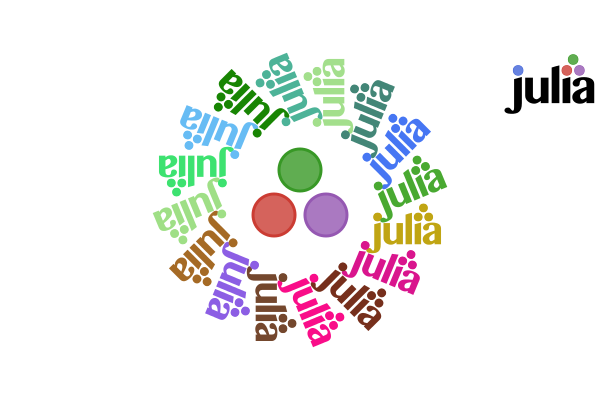
You can change the extension of the file name: "julia-logos.png" to "julia-logos.svg" or "julia-logos.pdf" or "julia-logos.eps" to produce alternative formats.
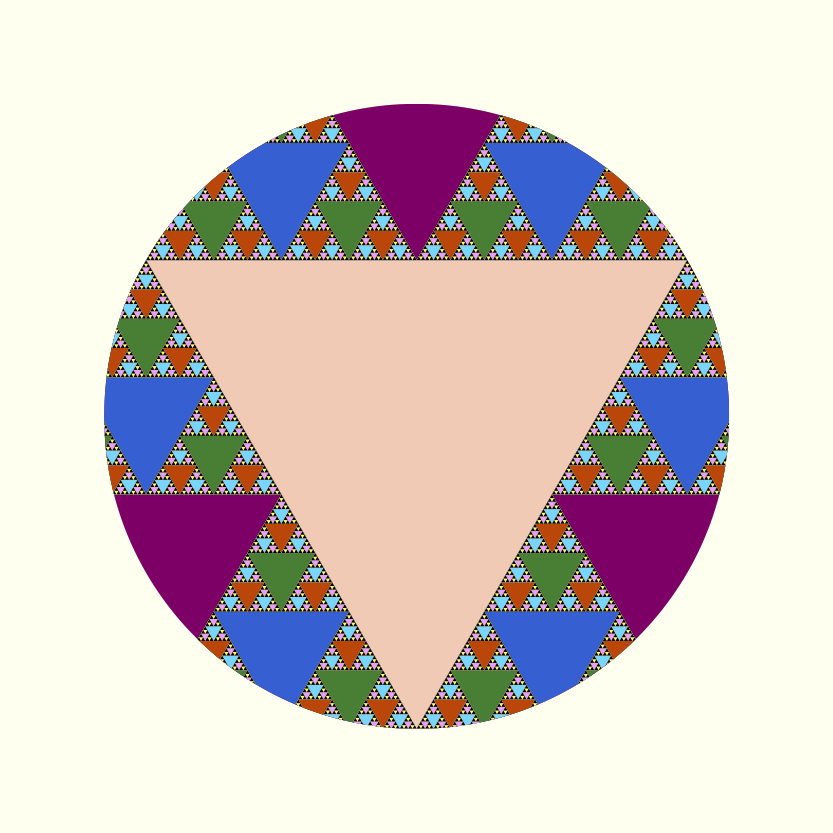
Something a bit more complicated: a Sierpinski triangle
Here's a version of the Sierpinski recursive triangle, clipped to a circle. (This and subsequent examples assume that the drawing has been created, the origin and background set.)
function triangle(points, degree)
    sethue(cols[degree])
    poly(points, :fill)
end

function sierpinski(points, degree)
    triangle(points, degree)
    if degree > 1
        p1, p2, p3 = points
        sierpinski([p1, midpoint(p1, p2),
                        midpoint(p1, p3)], degree-1)
        sierpinski([p2, midpoint(p1, p2),
                        midpoint(p2, p3)], degree-1)
        sierpinski([p3, midpoint(p3, p2),
                        midpoint(p1, p3)], degree-1)
    end
end

function draw(n)
    circle(O, 75, :clip)
    my_points = ngon(O, 150, 3, -pi/2, vertices=true)
    sierpinski(my_points, n)
end

depth = 8 # 12 is ok, 20 is right out (on my computer, at least)
cols = distinguishable_colors(depth)
draw(depth)
The main type (apart from the Drawing) is the Point, an immutable composite type containing x and y fields.
More complex examples
These examples are more elaborate.
Sector chart
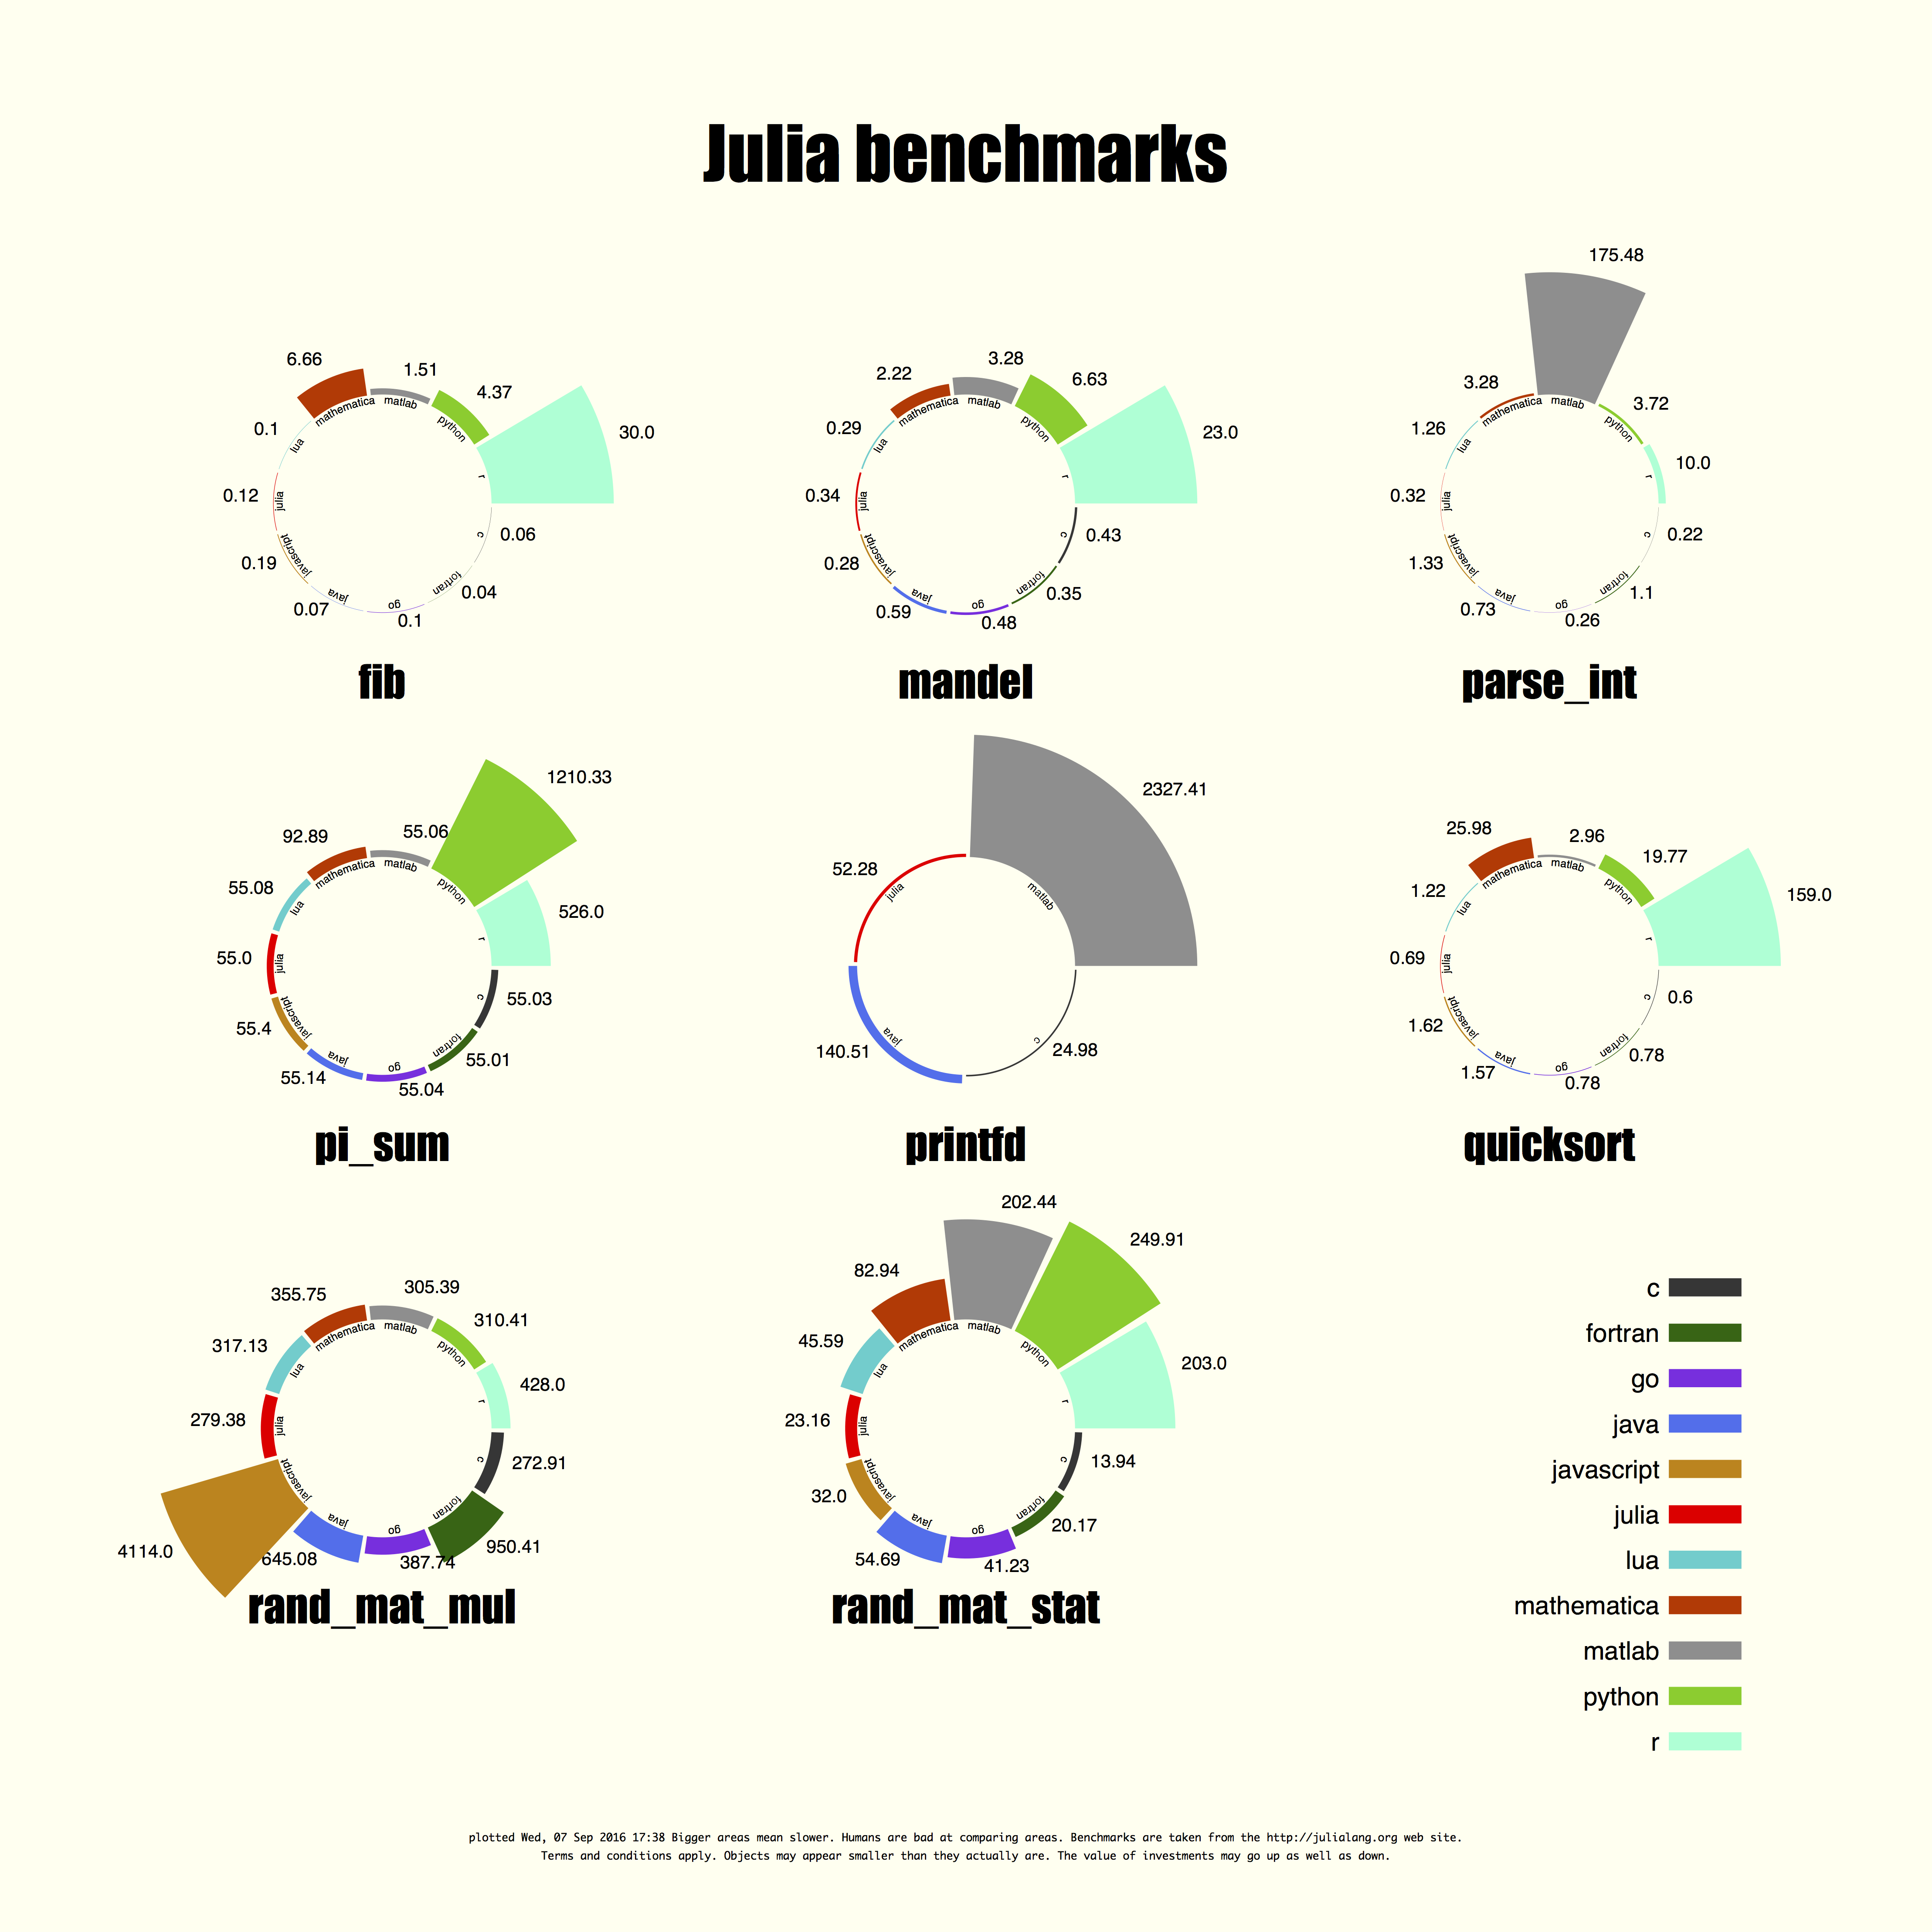
Sector charts look cool but they aren't always good at their job. This chart takes the raw benchmark scores from the Julia website and tries to render them literally as radiating sectors. The larger the sector, the slower the performance, so it's difficult to see the Julia scores sometimes...!
link to PDF original | link to Julia source
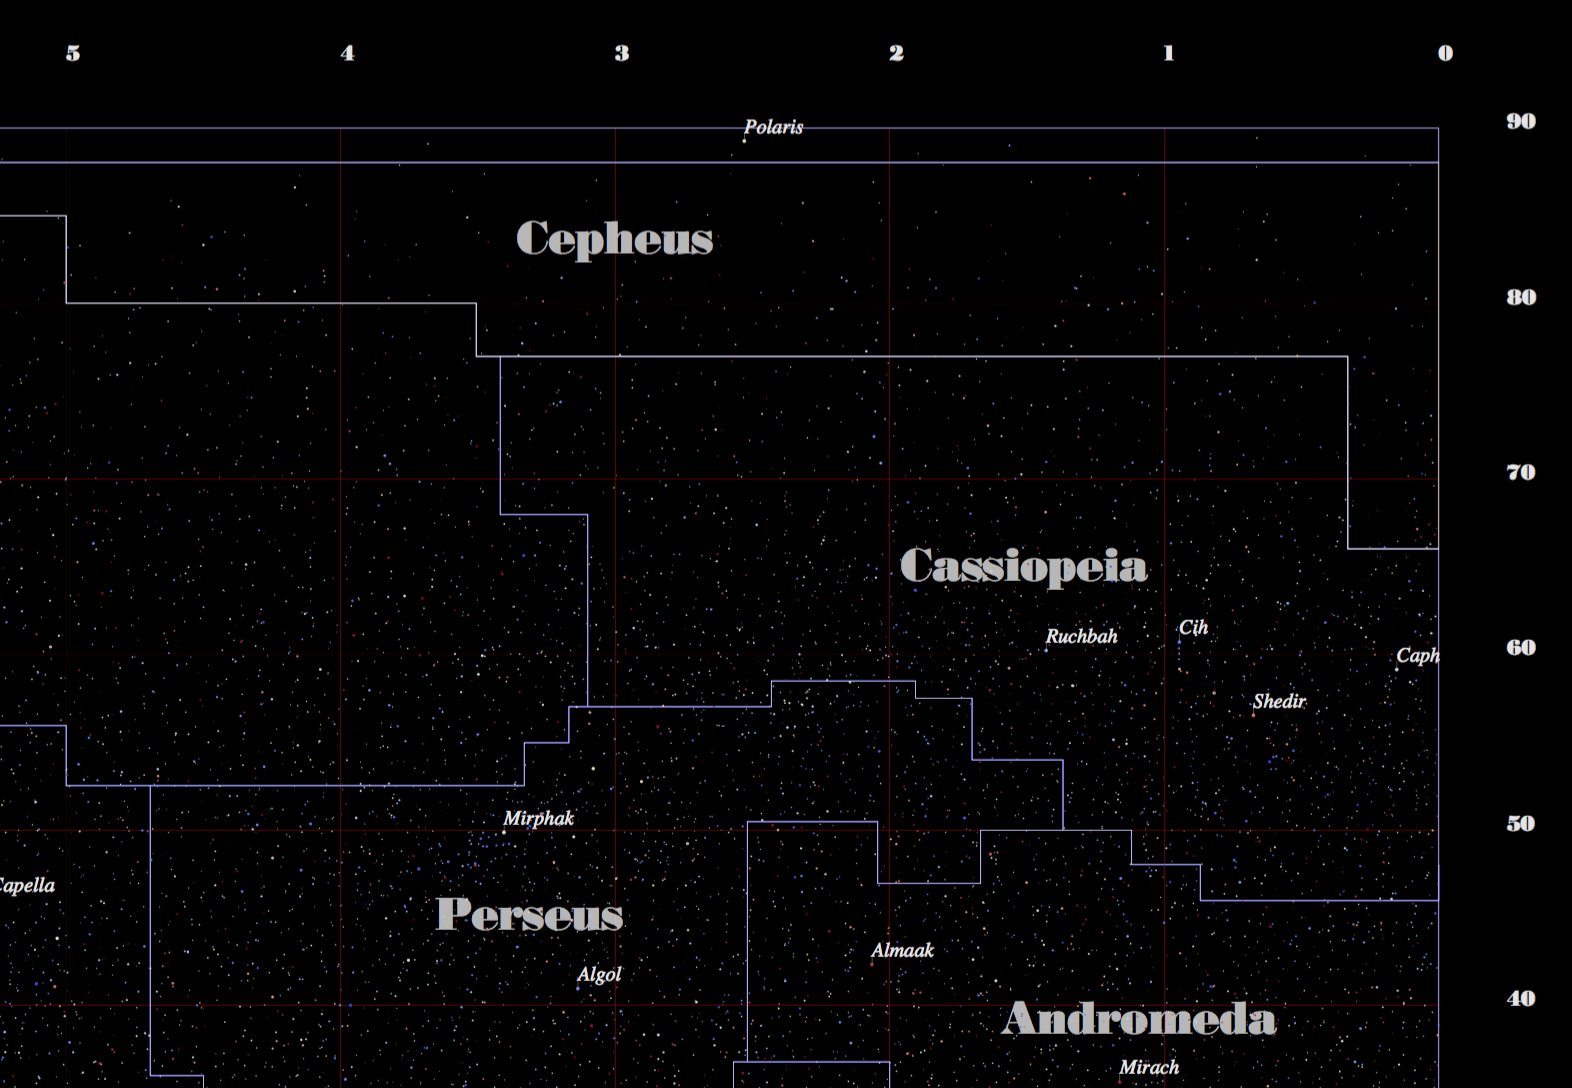
Star chart
Looking further afield, here's a straightforward chart rendering stars from the Astronexus HYG database catalog available on github and read into a DataFrame. There are a lot of challenges with representing so many stars—sizes, colors, constellation boundaries. It takes about 4 seconds to load the data, and 7 seconds to draw it— about 120,000 stars, using still-to-be-optimized code.
A small detail:
A more complete version:
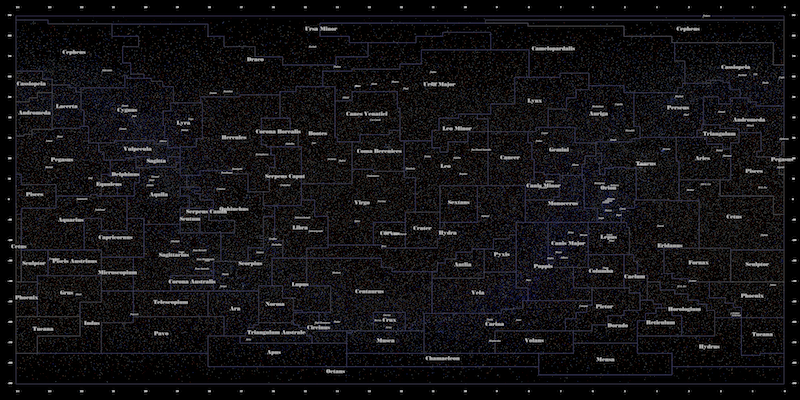
link to PDF original | link to Julia source
Ampersands
Here are a few ampersands collected together, mainly of interest to typomaniacs and fontophiles. It was necessary to vary the font size of each font, since they're naturally different.
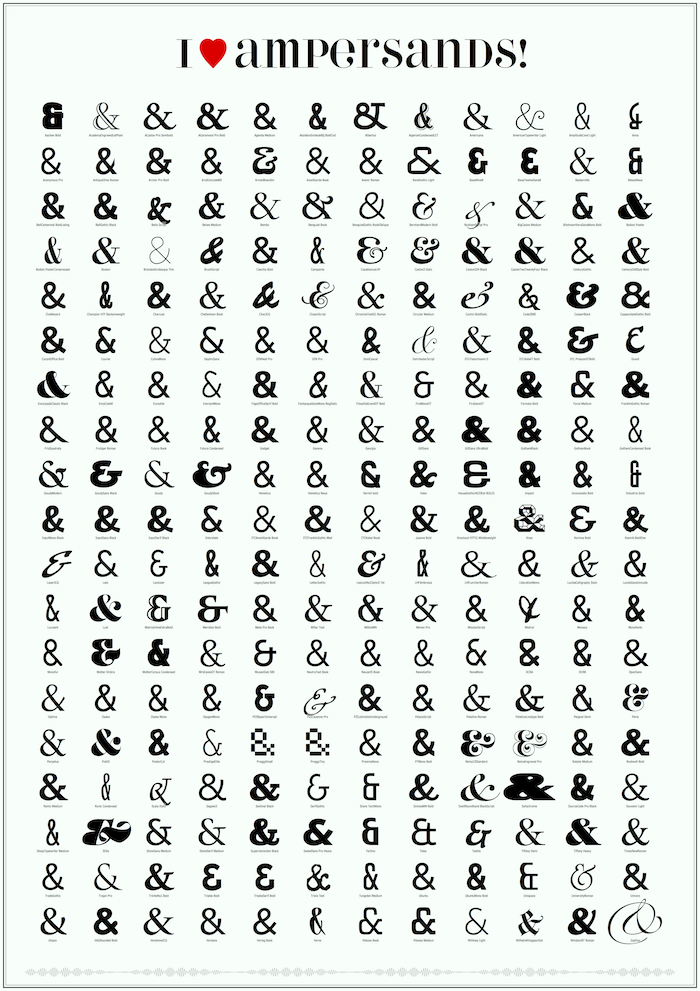
link to PDF original | link to Julia source
Moon phases
Looking upwards again, this moon phase chart shows the calculated phase of the moon for every day in a year.
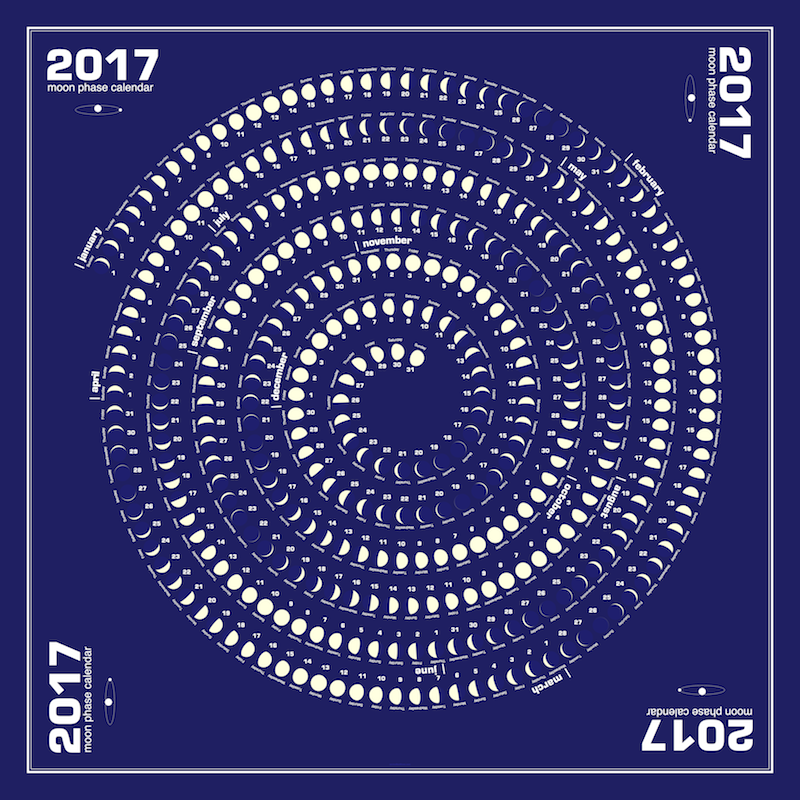
link to PDF original | link to github repository
Misc images
Sometimes you just want to take a line for a walk: