Placing images
Loading and placing images on drawings
Luxor lets you place existing images on the drawing. You can place PNG, SVG, and EPS images. (JPEGs aren't supported.)
For PNG and SVG, first load the image and create a reference to it. For example:
- for PNG images, use
img = readpng(filename) - for SVG images, use
img = readsvg(filename)orimg = readsvg(string)
You can access this image's dimensions with img.width and img.height.
Use placeimage(img) to place the image by its top left corner at point pt. Use the centered=true keyword to place the image's center point there.
img = readpng("../assets/figures/julia-logo-mask.png")
w = img.width
h = img.height
rulers()
scale(0.3, 0.3)
rotate(π/4)
placeimage(img, Point(-w/2, -h/2), .5)
sethue("red")
circle(-w/2, -h/2, 15, :fill)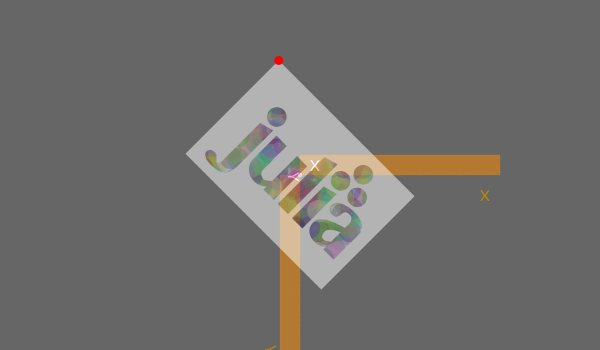
PNG images can be placed with varying opacity or transparency. For example, the image is placed with 0.5 opacity with:
placeimage(img, Point(100, 100), 0.5)SVG images do their own thing in terms of opacity.
readsvg also lets you supply raw (or pure) SVG code in a string.
You can use placeimage() to place an array of RGB or RGBA pixels on a drawing.
N = 500
i = reshape([RGBA(rand(4)...) for p in 1:N^2], N, N)
# i is Matrix{RGBA{Float64}}
# (alias for Array{RGBA{Float64}, 2})
@draw begin
  origin()
  sethue("orange")
  box(O, N/2, N/2, :fill)
  placeimage(i, O, centered=true, alpha=0.5)
end 500 500
Or you can load an image as an array and place it on a drawing.
using Luxor, Colors, FileIO
img = load(dirname(dirname(pathof(Luxor))) * "/docs/src/assets/figures/42.png")
@draw begin
    img[1:50, :] .= colorant"cyan"
    img[200:end, :] .= colorant"magenta"
    placeimage(img, O, centered=true, alpha=0.5)
end 250 250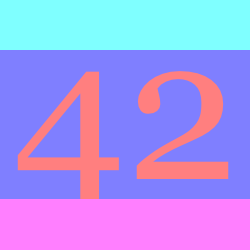
SVG images
To output a drawing as an SVG image, using the Drawing(... :svg) or specify an SVG filename. To obtain the SVG source of a completed SVG drawing, use svgstring.
For example, if you draw the Julia logo like this:
Drawing(500, 500, :svg)
origin()
julialogo()
finish()
s = svgstring()
You'll get the SVG source code stored, as a string, in s. You can examine or process it further. For example, the five colors used for the logo were:
eachmatch(r"rgb\\(.*?\\)", s) |> collect
5-element Vector{RegexMatch}:
 RegexMatch("rgb(0%,0%,0%)")
 RegexMatch("rgb(79.6%,23.5%,20%)")
 RegexMatch("rgb(25.1%,38.8%,84.7%)")
 RegexMatch("rgb(58.4%,34.5%,69.8%)")
 RegexMatch("rgb(22%,59.6%,14.9%)")
To display the image in a Jupyter or Pluto notebook, use the HTML function, or you can use the readsvg and placeimage functions in combination.
EPS images
EPS (Encapsulated PostScript) files created by Luxor (or any Cairo-based package) can be re-imported and placed on the current drawing with the placeeps function. This function converts the EPS commands to the equivalent Luxor commands and evaluates them immediately in the context of the current drawing.
This function is designed to extract just the coordinates of paths from an EPS file. An EPS file can contain much more information about an image than coordinates: there migth be image and pixel data, font data, linear color gradients, and so on. These are not translated into equivalent Luxor functions. This function interprets the EPS commands in a Cairo-generated EPS "Prolog"; EPS files created by other applications will likely not contain this Cairo-generated Prolog, and so won't be interpreted at all (or will go wrong in interesting ways).
In this example, an SVG file linnux.svg is placed and exported to an EPS file linux.eps, then this EPS file is imported and placed on a new SVG drawing using Luxor functions instead of EPS commands, respecting the current scale and orientation. Finally, when the SVG document is finished, the graphics will be in SVG format again.
using Luxor

svgfile = dirname(@__FILE__) * "../assets/figures/linux.svg"
epsfile = dirname(@__FILE__) * "../assets/figures/linux.eps"

@eps begin
    img = readsvg(svgfile)
    placeimage(img, centered = true)
end 500 500 epsfile

@drawsvg begin
    translate(midpoint(boxtopleft(), O))
    scale(0.5)
    rotate(π/12)
    placeeps(epsfile)
    rulers()
end;fill-opacity:1;" d="M 184.972656 156.265625 L 358.0625 202.644531 C 378.550781 208.132812 390.707031 229.1875 385.21875 249.675781 L 338.835938 422.769531 C 333.347656 443.253906 312.292969 455.410156 291.804688 449.921875 L 118.714844 403.542969 C 98.226562 398.050781 86.070312 376.996094 91.558594 356.511719 L 137.941406 183.417969 C 143.429688 162.929688 164.484375 150.773438 184.972656 156.265625 Z M 184.972656 156.265625 "/>
<path style=" stroke:none;fill-rule:nonzero;fill:rgb(20%25,20%25,20%25);fill-opacity:1;" d="M 213.949219 270.664062 C 209.238281 276.648438 183.261719 292.464844 179.5 314.230469 C 163.414062 405.167969 206.507812 352.527344 241.125 385.613281 C 241.125 385.613281 324.4375 364.457031 284.082031 283.242188 C 273.875 255.660156 293.28125 241.191406 286.796875 222.890625 C 280.3125 204.585938 262.21875 198.703125 244.8125 209.570312 C 227.40625 220.433594 241.03125 246.863281 213.949219 270.664062 "/>
<path style=" stroke:none;fill-rule:nonzero;fill:rgb(93.3333%25,93.3333%25,93.3333%25);fill-opacity:1;" d="M 273.523438 334.246094 C 273.523438 334.246094 286.875 319.191406 273.816406 302.234375 C 284.871094 322.796875 271.332031 334.695312 271.332031 334.695312 L 268.433594 333.917969 C 276.527344 299.855469 262.914062 315.875 266.40625 252.625 C 285.292969 240.085938 261.164062 218.089844 253.917969 245.136719 L 245.222656 242.808594 C 252.402344 219.886719 229.011719 226.039062 236.203125 245.566406 C 225.660156 281.046875 200.527344 289.84375 193.796875 314.957031 C 191.695312 295.757812 207.875 285.601562 207.875 285.601562 C 207.875 285.601562 186.605469 295.429688 191.539062 319.527344 C 196.46875 343.625 217.082031 343.972656 200.972656 350.007812 C 218.339844 370.191406 253.769531 369.332031 261.085938 338.164062 C 264.121094 330.695312 283.628906 339.027344 285.042969 341.476562 C 286.457031 343.925781 283.179688 336.835938 273.523438 334.246094 M 239.617188 244.410156 C 233.375 240.667969 237.636719 232.492188 240.535156 233.269531 C 243.429688 234.046875 246.449219 242.101562 239.617188 244.410156 M 257.710938 250.296875 C 254.695312 242.238281 260.371094 236.511719 264.941406 238.773438 C 269.511719 241.035156 266.40625 252.625 257.710938 250.296875 "/>
<path style="fill-rule:nonzero;fill:rgb(100%25,80%25,13.3333%25);fill-opacity:1;stroke-width:2;stroke-linecap:butt;stroke-linejoin:miter;stroke:rgb(20%25,20%25,20%25);stroke-opacity:1;stroke-miterlimit:10;" d="M 190.761719 322.425781 L 203.28125 356.839844 C 212.09375 366.445312 199.054688 391.941406 173.699219 370.652344 C 158.570312 361.421875 144.789062 358.765625 145.1875 349.554688 C 145.585938 340.34375 151.640625 340.929688 151.707031 336.808594 C 153.539062 314.523438 168.078125 329.804688 175.753906 320.476562 C 183.433594 311.144531 184.726562 306.3125 190.761719 322.425781 M 295.320312 364.9375 C 293.011719 358.105469 299.722656 348.515625 285.941406 345.859375 C 277.039062 355.894531 257.511719 363.085938 262.757812 339.644531 C 253.097656 337.058594 253.648438 362.050781 246.9375 371.640625 C 231.257812 395.390625 255.851562 404.054688 269.84375 394.34375 L 299.617188 383.6875 C 302.324219 381.304688 306 379.183594 295.320312 364.9375 M 230.269531 252.257812 C 228.921875 245.6875 244.515625 241.582031 249.347656 242.878906 C 254.175781 244.171875 259.902344 249.847656 266.144531 253.589844 C 272.390625 257.335938 267.679688 263.320312 265.488281 263.765625 C 263.300781 264.214844 250.34375 270.0625 242.617188 267.992188 C 234.890625 265.921875 235.027344 257.675781 230.269531 252.257812 "/>
<path style="fill-rule:nonzero;fill:rgb(100%25,80%25,13.3333%25);fill-opacity:1;stroke-width:2;stroke-linecap:butt;stroke-linejoin:miter;stroke:rgb(20%25,20%25,20%25);stroke-opacity:1;stroke-miterlimit:10;" d="M 230.527344 251.292969 C 236.703125 259.160156 244.101562 266.320312 265.109375 257.453125 "/>
<path style=" stroke:none;fill-rule:nonzero;fill:rgb(20%25,20%25,20%25);fill-opacity:1;" d="M 242.707031 248.34375 C 240.773438 247.828125 244.1875 246.671875 244.894531 247.898438 M 251.398438 250.675781 C 252.625 249.96875 250.949219 248.484375 248.757812 248.933594 "/>
<path style="fill-rule:nonzero;fill:rgb(100%25,54.9%25,0%25);fill-opacity:0.5;stroke-width:0.25;stroke-linecap:butt;stroke-linejoin:miter;stroke:rgb(100%25,54.9%25,0%25);stroke-opacity:0.5;stroke-miterlimit:10;" d="M 150 150 L 152.589844 140.339844 L 249.179688 166.222656 L 246.59375 175.882812 Z M 150 150 "/>
<path style="fill-rule:nonzero;fill:rgb(100%25,54.9%25,0%25);fill-opacity:0.5;stroke-width:0.25;stroke-linecap:butt;stroke-linejoin:miter;stroke:rgb(100%25,54.9%25,0%25);stroke-opacity:0.5;stroke-miterlimit:10;" d="M 114.457031 244.003906 L 140.339844 147.410156 L 150 150 L 124.117188 246.59375 Z M 114.457031 244.003906 "/>
<path style="fill:none;stroke-width:0.25;stroke-linecap:butt;stroke-linejoin:miter;stroke:rgb(72.2%25,52.5%25,4.3%25);stroke-opacity:1;stroke-miterlimit:10;" d="M 150 150 L 150.648438 147.585938 "/>
<path style="fill:none;stroke-width:0.25;stroke-linecap:butt;stroke-linejoin:miter;stroke:rgb(72.2%25,52.5%25,4.3%25);stroke-opacity:1;stroke-miterlimit:10;" d="M 154.828125 151.292969 L 155.476562 148.878906 "/>
<path style="fill:none;stroke-width:0.25;stroke-linecap:butt;stroke-linejoin:miter;stroke:rgb(72.2%25,52.5%25,4.3%25);stroke-opacity:1;stroke-miterlimit:10;" d="M 159.660156 152.589844 L 160.304688 150.171875 "/>
<path style="fill:none;stroke-width:0.25;stroke-linecap:butt;stroke-linejoin:miter;stroke:rgb(72.2%25,52.5%25,4.3%25);stroke-opacity:1;stroke-miterlimit:10;" d="M 164.488281 153.882812 L 165.136719 151.46875 "/>
<path style="fill:none;stroke-width:0.25;stroke-linecap:butt;stroke-linejoin:miter;stroke:rgb(72.2%25,52.5%25,4.3%25);stroke-opacity:1;stroke-miterlimit:10;" d="M 169.320312 155.175781 L 169.964844 152.761719 "/>
<path style="fill:none;stroke-width:0.25;stroke-linecap:butt;stroke-linejoin:miter;stroke:rgb(72.2%25,52.5%25,4.3%25);stroke-opacity:1;stroke-miterlimit:10;" d="M 174.148438 156.46875 L 174.796875 154.054688 "/>
<path style="fill:none;stroke-width:0.25;stroke-linecap:butt;stroke-linejoin:miter;stroke:rgb(72.2%25,52.5%25,4.3%25);stroke-opacity:1;stroke-miterlimit:10;" d="M 178.976562 157.765625 L 179.625 155.351562 "/>
<path style="fill:none;stroke-width:0.25;stroke-linecap:butt;stroke-linejoin:miter;stroke:rgb(72.2%25,52.5%25,4.3%25);stroke-opacity:1;stroke-miterlimit:10;" d="M 183.808594 159.058594 L 184.453125 156.644531 "/>
<path style="fill:none;stroke-width:0.25;stroke-linecap:butt;stroke-linejoin:miter;stroke:rgb(72.2%25,52.5%25,4.3%25);stroke-opacity:1;stroke-miterlimit:10;" d="M 188.636719 160.351562 L 189.285156 157.9375 "/>
<path style="fill:none;stroke-width:0.25;stroke-linecap:butt;stroke-linejoin:miter;stroke:rgb(72.2%25,52.5%25,4.3%25);stroke-opacity:1;stroke-miterlimit:10;" d="M 193.464844 161.648438 L 194.113281 159.230469 "/>
<path style="fill:none;stroke-width:0.25;stroke-linecap:butt;stroke-linejoin:miter;stroke:rgb(72.2%25,52.5%25,4.3%25);stroke-opacity:1;stroke-miterlimit:10;" d="M 198.296875 162.941406 L 198.941406 160.527344 "/>
<path style="fill:none;stroke-width:0.25;stroke-linecap:butt;stroke-linejoin:miter;stroke:rgb(72.2%25,52.5%25,4.3%25);stroke-opacity:1;stroke-miterlimit:10;" d="M 203.125 164.234375 L 203.773438 161.820312 "/>
<path style="fill:none;stroke-width:0.25;stroke-linecap:butt;stroke-linejoin:miter;stroke:rgb(72.2%25,52.5%25,4.3%25);stroke-opacity:1;stroke-miterlimit:10;" d="M 207.957031 165.527344 L 208.601562 163.113281 "/>
<path style="fill:none;stroke-width:0.25;stroke-linecap:butt;stroke-linejoin:miter;stroke:rgb(72.2%25,52.5%25,4.3%25);stroke-opacity:1;stroke-miterlimit:10;" d="M 212.785156 166.824219 L 213.433594 164.410156 "/>
<path style="fill:none;stroke-width:0.25;stroke-linecap:butt;stroke-linejoin:miter;stroke:rgb(72.2%25,52.5%25,4.3%25);stroke-opacity:1;stroke-miterlimit:10;" d="M 217.613281 168.117188 L 218.261719 165.703125 "/>
<path style="fill:none;stroke-width:0.25;stroke-linecap:butt;stroke-linejoin:miter;stroke:rgb(72.2%25,52.5%25,4.3%25);stroke-opacity:1;stroke-miterlimit:10;" d="M 222.445312 169.410156 L 223.089844 166.996094 "/>
<path style="fill:none;stroke-width:0.25;stroke-linecap:butt;stroke-linejoin:miter;stroke:rgb(72.2%25,52.5%25,4.3%25);stroke-opacity:1;stroke-miterlimit:10;" d="M 227.273438 170.707031 L 227.921875 168.289062 "/>
<path style="fill:none;stroke-width:0.25;stroke-linecap:butt;stroke-linejoin:miter;stroke:rgb(72.2%25,52.5%25,4.3%25);stroke-opacity:1;stroke-miterlimit:10;" d="M 232.105469 172 L 232.75 169.585938 "/>
<path style="fill:none;stroke-width:0.25;stroke-linecap:butt;stroke-linejoin:miter;stroke:rgb(72.2%25,52.5%25,4.3%25);stroke-opacity:1;stroke-miterlimit:10;" d="M 236.933594 173.292969 L 237.582031 170.878906 "/>
<path style="fill:none;stroke-width:0.25;stroke-linecap:butt;stroke-linejoin:miter;stroke:rgb(72.2%25,52.5%25,4.3%25);stroke-opacity:1;stroke-miterlimit:10;" d="M 241.761719 174.585938 L 242.410156 172.171875 "/>
<path style="fill:none;stroke-width:0.25;stroke-linecap:butt;stroke-linejoin:miter;stroke:rgb(72.2%25,52.5%25,4.3%25);stroke-opacity:1;stroke-miterlimit:10;" d="M 246.59375 175.882812 L 247.238281 173.46875 "/>
<path style="fill:none;stroke-width:0.25;stroke-linecap:butt;stroke-linejoin:miter;stroke:rgb(72.2%25,52.5%25,4.3%25);stroke-opacity:1;stroke-miterlimit:10;" d="M 147.585938 149.351562 L 150 150 "/>
<path style="fill:none;stroke-width:0.25;stroke-linecap:butt;stroke-linejoin:miter;stroke:rgb(72.2%25,52.5%25,4.3%25);stroke-opacity:1;stroke-miterlimit:10;" d="M 146.292969 154.183594 L 148.707031 154.828125 "/>
<path style="fill:none;stroke-width:0.25;stroke-linecap:butt;stroke-linejoin:miter;stroke:rgb(72.2%25,52.5%25,4.3%25);stroke-opacity:1;stroke-miterlimit:10;" d="M 144.996094 159.011719 L 147.410156 159.660156 "/>
<path style="fill:none;stroke-width:0.25;stroke-linecap:butt;stroke-linejoin:miter;stroke:rgb(72.2%25,52.5%25,4.3%25);stroke-opacity:1;stroke-miterlimit:10;" d="M 143.703125 163.84375 L 146.117188 164.488281 "/>
<path style="fill:none;stroke-width:0.25;stroke-linecap:butt;stroke-linejoin:miter;stroke:rgb(72.2%25,52.5%25,4.3%25);stroke-opacity:1;stroke-miterlimit:10;" d="M 142.410156 168.671875 L 144.824219 169.320312 "/>
<path style="fill:none;stroke-width:0.25;stroke-linecap:butt;stroke-linejoin:miter;stroke:rgb(72.2%25,52.5%25,4.3%25);stroke-opacity:1;stroke-miterlimit:10;" d="M 141.113281 173.5 L 143.53125 174.148438 "/>
<path style="fill:none;stroke-width:0.25;stroke-linecap:butt;stroke-linejoin:miter;stroke:rgb(72.2%25,52.5%25,4.3%25);stroke-opacity:1;stroke-miterlimit:10;" d="M 139.820312 178.332031 L 142.234375 178.976562 "/>
<path style="fill:none;stroke-width:0.25;stroke-linecap:butt;stroke-linejoin:miter;stroke:rgb(72.2%25,52.5%25,4.3%25);stroke-opacity:1;stroke-miterlimit:10;" d="M 138.527344 183.160156 L 140.941406 183.808594 "/>
<path style="fill:none;stroke-width:0.25;stroke-linecap:butt;stroke-linejoin:miter;stroke:rgb(72.2%25,52.5%25,4.3%25);stroke-opacity:1;stroke-miterlimit:10;" d="M 137.234375 187.988281 L 139.648438 188.636719 "/>
<path style="fill:none;stroke-width:0.25;stroke-linecap:butt;stroke-linejoin:miter;stroke:rgb(72.2%25,52.5%25,4.3%25);stroke-opacity:1;stroke-miterlimit:10;" d="M 135.9375 192.820312 L 138.351562 193.464844 "/>
<path style="fill:none;stroke-width:0.25;stroke-linecap:butt;stroke-linejoin:miter;stroke:rgb(72.2%25,52.5%25,4.3%25);stroke-opacity:1;stroke-miterlimit:10;" d="M 134.644531 197.648438 L 137.058594 198.296875 "/>
<path style="fill:none;stroke-width:0.25;stroke-linecap:butt;stroke-linejoin:miter;stroke:rgb(72.2%25,52.5%25,4.3%25);stroke-opacity:1;stroke-miterlimit:10;" d="M 133.351562 202.480469 L 135.765625 203.125 "/>
<path style="fill:none;stroke-width:0.25;stroke-linecap:butt;stroke-linejoin:miter;stroke:rgb(72.2%25,52.5%25,4.3%25);stroke-opacity:1;stroke-miterlimit:10;" d="M 132.054688 207.308594 L 134.472656 207.957031 "/>
<path style="fill:none;stroke-width:0.25;stroke-linecap:butt;stroke-linejoin:miter;stroke:rgb(72.2%25,52.5%25,4.3%25);stroke-opacity:1;stroke-miterlimit:10;" d="M 130.761719 212.136719 L 133.175781 212.785156 "/>
<path style="fill:none;stroke-width:0.25;stroke-linecap:butt;stroke-linejoin:miter;stroke:rgb(72.2%25,52.5%25,4.3%25);stroke-opacity:1;stroke-miterlimit:10;" d="M 129.46875 216.96875 L 131.882812 217.613281 "/>
<path style="fill:none;stroke-width:0.25;stroke-linecap:butt;stroke-linejoin:miter;stroke:rgb(72.2%25,52.5%25,4.3%25);stroke-opacity:1;stroke-miterlimit:10;" d="M 128.171875 221.796875 L 130.589844 222.445312 "/>
<path style="fill:none;stroke-width:0.25;stroke-linecap:butt;stroke-linejoin:miter;stroke:rgb(72.2%25,52.5%25,4.3%25);stroke-opacity:1;stroke-miterlimit:10;" d="M 126.878906 226.628906 L 129.292969 227.273438 "/>
<path style="fill:none;stroke-width:0.25;stroke-linecap:butt;stroke-linejoin:miter;stroke:rgb(72.2%25,52.5%25,4.3%25);stroke-opacity:1;stroke-miterlimit:10;" d="M 125.585938 231.457031 L 128 232.105469 "/>
<path style="fill:none;stroke-width:0.25;stroke-linecap:butt;stroke-linejoin:miter;stroke:rgb(72.2%25,52.5%25,4.3%25);stroke-opacity:1;stroke-miterlimit:10;" d="M 124.292969 236.285156 L 126.707031 236.933594 "/>
<path style="fill:none;stroke-width:0.25;stroke-linecap:butt;stroke-linejoin:miter;stroke:rgb(72.2%25,52.5%25,4.3%25);stroke-opacity:1;stroke-miterlimit:10;" d="M 122.996094 241.117188 L 125.414062 241.761719 "/>
<path style="fill:none;stroke-width:0.25;stroke-linecap:butt;stroke-linejoin:miter;stroke:rgb(72.2%25,52.5%25,4.3%25);stroke-opacity:1;stroke-miterlimit:10;" d="M 121.703125 245.945312 L 124.117188 246.59375 "/>
<path style="fill:none;stroke-width:0.25;stroke-linecap:butt;stroke-linejoin:miter;stroke:rgb(72.2%25,52.5%25,4.3%25);stroke-opacity:1;stroke-miterlimit:10;" d="M 150 150 L 150.429688 148.390625 "/>
<path style="fill:none;stroke-width:0.25;stroke-linecap:butt;stroke-linejoin:miter;stroke:rgb(72.2%25,52.5%25,4.3%25);stroke-opacity:1;stroke-miterlimit:10;" d="M 152.414062 150.648438 L 152.847656 149.039062 "/>
<path style="fill:none;stroke-width:0.25;stroke-linecap:butt;stroke-linejoin:miter;stroke:rgb(72.2%25,52.5%25,4.3%25);stroke-opacity:1;stroke-miterlimit:10;" d="M 154.828125 151.292969 L 155.261719 149.683594 "/>
<path style="fill:none;stroke-width:0.25;stroke-linecap:butt;stroke-linejoin:miter;stroke:rgb(72.2%25,52.5%25,4.3%25);stroke-opacity:1;stroke-miterlimit:10;" d="M 157.246094 151.941406 L 157.675781 150.332031 "/>
<path style="fill:none;stroke-width:0.25;stroke-linecap:butt;stroke-linejoin:miter;stroke:rgb(72.2%25,52.5%25,4.3%25);stroke-opacity:1;stroke-miterlimit:10;" d="M 159.660156 152.589844 L 160.089844 150.976562 "/>
<path style="fill:none;stroke-width:0.25;stroke-linecap:butt;stroke-linejoin:miter;stroke:rgb(72.2%25,52.5%25,4.3%25);stroke-opacity:1;stroke-miterlimit:10;" d="M 162.074219 153.234375 L 162.503906 151.625 "/>
<path style="fill:none;stroke-width:0.25;stroke-linecap:butt;stroke-linejoin:miter;stroke:rgb(72.2%25,52.5%25,4.3%25);stroke-opacity:1;stroke-miterlimit:10;" d="M 164.488281 153.882812 L 164.921875 152.273438 "/>
<path style="fill:none;stroke-width:0.25;stroke-linecap:butt;stroke-linejoin:miter;stroke:rgb(72.2%25,52.5%25,4.3%25);stroke-opacity:1;stroke-miterlimit:10;" d="M 166.902344 154.53125 L 167.335938 152.917969 "/>
<path style="fill:none;stroke-width:0.25;stroke-linecap:butt;stroke-linejoin:miter;stroke:rgb(72.2%25,52.5%25,4.3%25);stroke-opacity:1;stroke-miterlimit:10;" d="M 169.320312 155.175781 L 169.75 153.566406 "/>
<path style="fill:none;stroke-width:0.25;stroke-linecap:butt;stroke-linejoin:miter;stroke:rgb(72.2%25,52.5%25,4.3%25);stroke-opacity:1;stroke-miterlimit:10;" d="M 171.734375 155.824219 L 172.164062 154.214844 "/>
<path style="fill:none;stroke-width:0.25;stroke-linecap:butt;stroke-linejoin:miter;stroke:rgb(72.2%25,52.5%25,4.3%25);stroke-opacity:1;stroke-miterlimit:10;" d="M 174.148438 156.46875 L 174.578125 154.859375 "/>
<path style="fill:none;stroke-width:0.25;stroke-linecap:butt;stroke-linejoin:miter;stroke:rgb(72.2%25,52.5%25,4.3%25);stroke-opacity:1;stroke-miterlimit:10;" d="M 176.5625 157.117188 L 176.996094 155.507812 "/>
<path style="fill:none;stroke-width:0.25;stroke-linecap:butt;stroke-linejoin:miter;stroke:rgb(72.2%25,52.5%25,4.3%25);stroke-opacity:1;stroke-miterlimit:10;" d="M 178.976562 157.765625 L 179.410156 156.15625 "/>
<path style="fill:none;stroke-width:0.25;stroke-linecap:butt;stroke-linejoin:miter;stroke:rgb(72.2%25,52.5%25,4.3%25);stroke-opacity:1;stroke-miterlimit:10;" d="M 181.394531 158.410156 L 181.824219 156.800781 "/>
<path style="fill:none;stroke-width:0.25;stroke-linecap:butt;stroke-linejoin:miter;stroke:rgb(72.2%25,52.5%25,4.3%25);stroke-opacity:1;stroke-miterlimit:10;" d="M 183.808594 159.058594 L 184.238281 157.449219 "/>
<path style="fill:none;stroke-width:0.25;stroke-linecap:butt;stroke-linejoin:miter;stroke:rgb(72.2%25,52.5%25,4.3%25);stroke-opacity:1;stroke-miterlimit:10;" d="M 186.222656 159.707031 L 186.652344 158.097656 "/>
<path style="fill:none;stroke-width:0.25;stroke-linecap:butt;stroke-linejoin:miter;stroke:rgb(72.2%25,52.5%25,4.3%25);stroke-opacity:1;stroke-miterlimit:10;" d="M 188.636719 160.351562 L 189.070312 158.742188 "/>
<path style="fill:none;stroke-width:0.25;stroke-linecap:butt;stroke-linejoin:miter;stroke:rgb(72.2%25,52.5%25,4.3%25);stroke-opacity:1;stroke-miterlimit:10;" d="M 191.050781 161 L 191.484375 159.390625 "/>
<path style="fill:none;stroke-width:0.25;stroke-linecap:butt;stroke-linejoin:miter;stroke:rgb(72.2%25,52.5%25,4.3%25);stroke-opacity:1;stroke-miterlimit:10;" d="M 193.464844 161.648438 L 193.898438 160.035156 "/>
<path style="fill:none;stroke-width:0.25;stroke-linecap:butt;stroke-linejoin:miter;stroke:rgb(72.2%25,52.5%25,4.3%25);stroke-opacity:1;stroke-miterlimit:10;" d="M 195.882812 162.292969 L 196.3125 160.683594 "/>
<path style="fill:none;stroke-width:0.25;stroke-linecap:butt;stroke-linejoin:miter;stroke:rgb(72.2%25,52.5%25,4.3%25);stroke-opacity:1;stroke-miterlimit:10;" d="M 198.296875 162.941406 L 198.726562 161.332031 "/>
<path style="fill:none;stroke-width:0.25;stroke-linecap:butt;stroke-linejoin:miter;stroke:rgb(72.2%25,52.5%25,4.3%25);stroke-opacity:1;stroke-miterlimit:10;" d="M 200.710938 163.589844 L 201.140625 161.976562 "/>
<path style="fill:none;stroke-width:0.25;stroke-linecap:butt;stroke-linejoin:miter;stroke:rgb(72.2%25,52.5%25,4.3%25);stroke-opacity:1;stroke-miterlimit:10;" d="M 203.125 164.234375 L 203.558594 162.625 "/>
<path style="fill:none;stroke-width:0.25;stroke-linecap:butt;stroke-linejoin:miter;stroke:rgb(72.2%25,52.5%25,4.3%25);stroke-opacity:1;stroke-miterlimit:10;" d="M 205.539062 164.882812 L 205.972656 163.273438 "/>
<path style="fill:none;stroke-width:0.25;stroke-linecap:butt;stroke-linejoin:miter;stroke:rgb(72.2%25,52.5%25,4.3%25);stroke-opacity:1;stroke-miterlimit:10;" d="M 207.957031 165.527344 L 208.386719 163.917969 "/>
<path style="fill:none;stroke-width:0.25;stroke-linecap:butt;stroke-linejoin:miter;stroke:rgb(72.2%25,52.5%25,4.3%25);stroke-opacity:1;stroke-miterlimit:10;" d="M 210.371094 166.175781 L 210.800781 164.566406 "/>
<path style="fill:none;stroke-width:0.25;stroke-linecap:butt;stroke-linejoin:miter;stroke:rgb(72.2%25,52.5%25,4.3%25);stroke-opacity:1;stroke-miterlimit:10;" d="M 212.785156 166.824219 L 213.214844 165.214844 "/>
<path style="fill:none;stroke-width:0.25;stroke-linecap:butt;stroke-linejoin:miter;stroke:rgb(72.2%25,52.5%25,4.3%25);stroke-opacity:1;stroke-miterlimit:10;" d="M 215.199219 167.46875 L 215.632812 165.859375 "/>
<path style="fill:none;stroke-width:0.25;stroke-linecap:butt;stroke-linejoin:miter;stroke:rgb(72.2%25,52.5%25,4.3%25);stroke-opacity:1;stroke-miterlimit:10;" d="M 217.613281 168.117188 L 218.046875 166.507812 "/>
<path style="fill:none;stroke-width:0.25;stroke-linecap:butt;stroke-linejoin:miter;stroke:rgb(72.2%25,52.5%25,4.3%25);stroke-opacity:1;stroke-miterlimit:10;" d="M 220.03125 168.765625 L 220.460938 167.15625 "/>
<path style="fill:none;stroke-width:0.25;stroke-linecap:butt;stroke-linejoin:miter;stroke:rgb(72.2%25,52.5%25,4.3%25);stroke-opacity:1;stroke-miterlimit:10;" d="M 222.445312 169.410156 L 222.875 167.800781 "/>
<path style="fill:none;stroke-width:0.25;stroke-linecap:butt;stroke-linejoin:miter;stroke:rgb(72.2%25,52.5%25,4.3%25);stroke-opacity:1;stroke-miterlimit:10;" d="M 224.859375 170.058594 L 225.289062 168.449219 "/>
<path style="fill:none;stroke-width:0.25;stroke-linecap:butt;stroke-linejoin:miter;stroke:rgb(72.2%25,52.5%25,4.3%25);stroke-opacity:1;stroke-miterlimit:10;" d="M 227.273438 170.707031 L 227.707031 169.09375 "/>
<path style="fill:none;stroke-width:0.25;stroke-linecap:butt;stroke-linejoin:miter;stroke:rgb(72.2%25,52.5%25,4.3%25);stroke-opacity:1;stroke-miterlimit:10;" d="M 229.6875 171.351562 L 230.121094 169.742188 "/>
<path style="fill:none;stroke-width:0.25;stroke-linecap:butt;stroke-linejoin:miter;stroke:rgb(72.2%25,52.5%25,4.3%25);stroke-opacity:1;stroke-miterlimit:10;" d="M 232.105469 172 L 232.535156 170.390625 "/>
<path style="fill:none;stroke-width:0.25;stroke-linecap:butt;stroke-linejoin:miter;stroke:rgb(72.2%25,52.5%25,4.3%25);stroke-opacity:1;stroke-miterlimit:10;" d="M 234.519531 172.648438 L 234.949219 171.035156 "/>
<path style="fill:none;stroke-width:0.25;stroke-linecap:butt;stroke-linejoin:miter;stroke:rgb(72.2%25,52.5%25,4.3%25);stroke-opacity:1;stroke-miterlimit:10;" d="M 236.933594 173.292969 L 237.363281 171.683594 "/>
<path style="fill:none;stroke-width:0.25;stroke-linecap:butt;stroke-linejoin:miter;stroke:rgb(72.2%25,52.5%25,4.3%25);stroke-opacity:1;stroke-miterlimit:10;" d="M 239.347656 173.941406 L 239.78125 172.332031 "/>
<path style="fill:none;stroke-width:0.25;stroke-linecap:butt;stroke-linejoin:miter;stroke:rgb(72.2%25,52.5%25,4.3%25);stroke-opacity:1;stroke-miterlimit:10;" d="M 241.761719 174.585938 L 242.195312 172.976562 "/>
<path style="fill:none;stroke-width:0.25;stroke-linecap:butt;stroke-linejoin:miter;stroke:rgb(72.2%25,52.5%25,4.3%25);stroke-opacity:1;stroke-miterlimit:10;" d="M 244.179688 175.234375 L 244.609375 173.625 "/>
<path style="fill:none;stroke-width:0.25;stroke-linecap:butt;stroke-linejoin:miter;stroke:rgb(72.2%25,52.5%25,4.3%25);stroke-opacity:1;stroke-miterlimit:10;" d="M 246.59375 175.882812 L 247.023438 174.273438 "/>
<path style="fill:none;stroke-width:0.25;stroke-linecap:butt;stroke-linejoin:miter;stroke:rgb(72.2%25,52.5%25,4.3%25);stroke-opacity:1;stroke-miterlimit:10;" d="M 148.390625 149.570312 L 150 150 "/>
<path style="fill:none;stroke-width:0.25;stroke-linecap:butt;stroke-linejoin:miter;stroke:rgb(72.2%25,52.5%25,4.3%25);stroke-opacity:1;stroke-miterlimit:10;" d="M 147.742188 151.984375 L 149.351562 152.414062 "/>
<path style="fill:none;stroke-width:0.25;stroke-linecap:butt;stroke-linejoin:miter;stroke:rgb(72.2%25,52.5%25,4.3%25);stroke-opacity:1;stroke-miterlimit:10;" d="M 147.097656 154.398438 L 148.707031 154.828125 "/>
<path style="fill:none;stroke-width:0.25;stroke-linecap:butt;stroke-linejoin:miter;stroke:rgb(72.2%25,52.5%25,4.3%25);stroke-opacity:1;stroke-miterlimit:10;" d="M 146.449219 156.8125 L 148.058594 157.246094 "/>
<path style="fill:none;stroke-width:0.25;stroke-linecap:butt;stroke-linejoin:miter;stroke:rgb(72.2%25,52.5%25,4.3%25);stroke-opacity:1;stroke-miterlimit:10;" d="M 145.800781 159.226562 L 147.410156 159.660156 "/>
<path style="fill:none;stroke-width:0.25;stroke-linecap:butt;stroke-linejoin:miter;stroke:rgb(72.2%25,52.5%25,4.3%25);stroke-opacity:1;stroke-miterlimit:10;" d="M 145.15625 161.644531 L 146.765625 162.074219 "/>
<path style="fill:none;stroke-width:0.25;stroke-linecap:butt;stroke-linejoin:miter;stroke:rgb(72.2%25,52.5%25,4.3%25);stroke-opacity:1;stroke-miterlimit:10;" d="M 144.507812 164.058594 L 146.117188 164.488281 "/>
<path style="fill:none;stroke-width:0.25;stroke-linecap:butt;stroke-linejoin:miter;stroke:rgb(72.2%25,52.5%25,4.3%25);stroke-opacity:1;stroke-miterlimit:10;" d="M 143.859375 166.472656 L 145.46875 166.902344 "/>
<path style="fill:none;stroke-width:0.25;stroke-linecap:butt;stroke-linejoin:miter;stroke:rgb(72.2%25,52.5%25,4.3%25);stroke-opacity:1;stroke-miterlimit:10;" d="M 143.214844 168.886719 L 144.824219 169.320312 "/>
<path style="fill:none;stroke-width:0.25;stroke-linecap:butt;stroke-linejoin:miter;stroke:rgb(72.2%25,52.5%25,4.3%25);stroke-opacity:1;stroke-miterlimit:10;" d="M 142.566406 171.300781 L 144.175781 171.734375 "/>
<path style="fill:none;stroke-width:0.25;stroke-linecap:butt;stroke-linejoin:miter;stroke:rgb(72.2%25,52.5%25,4.3%25);stroke-opacity:1;stroke-miterlimit:10;" d="M 141.917969 173.714844 L 143.53125 174.148438 "/>
<path style="fill:none;stroke-width:0.25;stroke-linecap:butt;stroke-linejoin:miter;stroke:rgb(72.2%25,52.5%25,4.3%25);stroke-opacity:1;stroke-miterlimit:10;" d="M 141.273438 176.132812 L 142.882812 176.5625 "/>
<path style="fill:none;stroke-width:0.25;stroke-linecap:butt;stroke-linejoin:miter;stroke:rgb(72.2%25,52.5%25,4.3%25);stroke-opacity:1;stroke-miterlimit:10;" d="M 140.625 178.546875 L 142.234375 178.976562 "/>
<path style="fill:none;stroke-width:0.25;stroke-linecap:butt;stroke-linejoin:miter;stroke:rgb(72.2%25,52.5%25,4.3%25);stroke-opacity:1;stroke-miterlimit:10;" d="M 139.976562 180.960938 L 141.589844 181.394531 "/>
<path style="fill:none;stroke-width:0.25;stroke-linecap:butt;stroke-linejoin:miter;stroke:rgb(72.2%25,52.5%25,4.3%25);stroke-opacity:1;stroke-miterlimit:10;" d="M 139.332031 183.375 L 140.941406 183.808594 "/>
<path style="fill:none;stroke-width:0.25;stroke-linecap:butt;stroke-linejoin:miter;stroke:rgb(72.2%25,52.5%25,4.3%25);stroke-opacity:1;stroke-miterlimit:10;" d="M 138.683594 185.789062 L 140.292969 186.222656 "/>
<path style="fill:none;stroke-width:0.25;stroke-linecap:butt;stroke-linejoin:miter;stroke:rgb(72.2%25,52.5%25,4.3%25);stroke-opacity:1;stroke-miterlimit:10;" d="M 138.039062 188.207031 L 139.648438 188.636719 "/>
<path style="fill:none;stroke-width:0.25;stroke-linecap:butt;stroke-linejoin:miter;stroke:rgb(72.2%25,52.5%25,4.3%25);stroke-opacity:1;stroke-miterlimit:10;" d="M 137.390625 190.621094 L 139 191.050781 "/>
<path style="fill:none;stroke-width:0.25;stroke-linecap:butt;stroke-linejoin:miter;stroke:rgb(72.2%25,52.5%25,4.3%25);stroke-opacity:1;stroke-miterlimit:10;" d="M 136.742188 193.035156 L 138.351562 193.464844 "/>
<path style="fill:none;stroke-width:0.25;stroke-linecap:butt;stroke-linejoin:miter;stroke:rgb(72.2%25,52.5%25,4.3%25);stroke-opacity:1;stroke-miterlimit:10;" d="M 136.097656 195.449219 L 137.707031 195.882812 "/>
<path style="fill:none;stroke-width:0.25;stroke-linecap:butt;stroke-linejoin:miter;stroke:rgb(72.2%25,52.5%25,4.3%25);stroke-opacity:1;stroke-miterlimit:10;" d="M 135.449219 197.863281 L 137.058594 198.296875 "/>
<path style="fill:none;stroke-width:0.25;stroke-linecap:butt;stroke-linejoin:miter;stroke:rgb(72.2%25,52.5%25,4.3%25);stroke-opacity:1;stroke-miterlimit:10;" d="M 134.800781 200.28125 L 136.410156 200.710938 "/>
<path style="fill:none;stroke-width:0.25;stroke-linecap:butt;stroke-linejoin:miter;stroke:rgb(72.2%25,52.5%25,4.3%25);stroke-opacity:1;stroke-miterlimit:10;" d="M 134.15625 202.695312 L 135.765625 203.125 "/>
<path style="fill:none;stroke-width:0.25;stroke-linecap:butt;stroke-linejoin:miter;stroke:rgb(72.2%25,52.5%25,4.3%25);stroke-opacity:1;stroke-miterlimit:10;" d="M 133.507812 205.109375 L 135.117188 205.539062 "/>
<path style="fill:none;stroke-width:0.25;stroke-linecap:butt;stroke-linejoin:miter;stroke:rgb(72.2%25,52.5%25,4.3%25);stroke-opacity:1;stroke-miterlimit:10;" d="M 132.859375 207.523438 L 134.472656 207.957031 "/>
<path style="fill:none;stroke-width:0.25;stroke-linecap:butt;stroke-linejoin:miter;stroke:rgb(72.2%25,52.5%25,4.3%25);stroke-opacity:1;stroke-miterlimit:10;" d="M 132.214844 209.9375 L 133.824219 210.371094 "/>
<path style="fill:none;stroke-width:0.25;stroke-linecap:butt;stroke-linejoin:miter;stroke:rgb(72.2%25,52.5%25,4.3%25);stroke-opacity:1;stroke-miterlimit:10;" d="M 131.566406 212.355469 L 133.175781 212.785156 "/>
<path style="fill:none;stroke-width:0.25;stroke-linecap:butt;stroke-linejoin:miter;stroke:rgb(72.2%25,52.5%25,4.3%25);stroke-opacity:1;stroke-miterlimit:10;" d="M 130.917969 214.769531 L 132.53125 215.199219 "/>
<path style="fill:none;stroke-width:0.25;stroke-linecap:butt;stroke-linejoin:miter;stroke:rgb(72.2%25,52.5%25,4.3%25);stroke-opacity:1;stroke-miterlimit:10;" d="M 130.273438 217.183594 L 131.882812 217.613281 "/>
<path style="fill:none;stroke-width:0.25;stroke-linecap:butt;stroke-linejoin:miter;stroke:rgb(72.2%25,52.5%25,4.3%25);stroke-opacity:1;stroke-miterlimit:10;" d="M 129.625 219.597656 L 131.234375 220.03125 "/>
<path style="fill:none;stroke-width:0.25;stroke-linecap:butt;stroke-linejoin:miter;stroke:rgb(72.2%25,52.5%25,4.3%25);stroke-opacity:1;stroke-miterlimit:10;" d="M 128.980469 222.011719 L 130.589844 222.445312 "/>
<path style="fill:none;stroke-width:0.25;stroke-linecap:butt;stroke-linejoin:miter;stroke:rgb(72.2%25,52.5%25,4.3%25);stroke-opacity:1;stroke-miterlimit:10;" d="M 128.332031 224.429688 L 129.941406 224.859375 "/>
<path style="fill:none;stroke-width:0.25;stroke-linecap:butt;stroke-linejoin:miter;stroke:rgb(72.2%25,52.5%25,4.3%25);stroke-opacity:1;stroke-miterlimit:10;" d="M 127.683594 226.84375 L 129.292969 227.273438 "/>
<path style="fill:none;stroke-width:0.25;stroke-linecap:butt;stroke-linejoin:miter;stroke:rgb(72.2%25,52.5%25,4.3%25);stroke-opacity:1;stroke-miterlimit:10;" d="M 127.039062 229.257812 L 128.648438 229.6875 "/>
<path style="fill:none;stroke-width:0.25;stroke-linecap:butt;stroke-linejoin:miter;stroke:rgb(72.2%25,52.5%25,4.3%25);stroke-opacity:1;stroke-miterlimit:10;" d="M 126.390625 231.671875 L 128 232.105469 "/>
<path style="fill:none;stroke-width:0.25;stroke-linecap:butt;stroke-linejoin:miter;stroke:rgb(72.2%25,52.5%25,4.3%25);stroke-opacity:1;stroke-miterlimit:10;" d="M 125.742188 234.085938 L 127.351562 234.519531 "/>
<path style="fill:none;stroke-width:0.25;stroke-linecap:butt;stroke-linejoin:miter;stroke:rgb(72.2%25,52.5%25,4.3%25);stroke-opacity:1;stroke-miterlimit:10;" d="M 125.097656 236.503906 L 126.707031 236.933594 "/>
<path style="fill:none;stroke-width:0.25;stroke-linecap:butt;stroke-linejoin:miter;stroke:rgb(72.2%25,52.5%25,4.3%25);stroke-opacity:1;stroke-miterlimit:10;" d="M 124.449219 238.917969 L 126.058594 239.347656 "/>
<path style="fill:none;stroke-width:0.25;stroke-linecap:butt;stroke-linejoin:miter;stroke:rgb(72.2%25,52.5%25,4.3%25);stroke-opacity:1;stroke-miterlimit:10;" d="M 123.800781 241.332031 L 125.414062 241.761719 "/>
<path style="fill:none;stroke-width:0.25;stroke-linecap:butt;stroke-linejoin:miter;stroke:rgb(72.2%25,52.5%25,4.3%25);stroke-opacity:1;stroke-miterlimit:10;" d="M 123.15625 243.746094 L 124.765625 244.179688 "/>
<path style="fill:none;stroke-width:0.25;stroke-linecap:butt;stroke-linejoin:miter;stroke:rgb(72.2%25,52.5%25,4.3%25);stroke-opacity:1;stroke-miterlimit:10;" d="M 122.507812 246.160156 L 124.117188 246.59375 "/>
<g style="fill:rgb(72.2%25,52.5%25,4.3%25);fill-opacity:1;">
<use xlink:href="%23glyph-9765950-1" x="154.599897" y="147.781618"/>
<use xlink:href="%23glyph-9765950-2" x="155.160134" y="147.931733"/>
</g>
<g style="fill:rgb(72.2%25,52.5%25,4.3%25);fill-opacity:1;">
<use xlink:href="%23glyph-9765950-3" x="159.429526" y="149.075713"/>
<use xlink:href="%23glyph-9765950-2" x="159.989763" y="149.225828"/>
</g>
<g style="fill:rgb(72.2%25,52.5%25,4.3%25);fill-opacity:1;">
<use xlink:href="%23glyph-9765950-4" x="164.259155" y="150.369809"/>
<use xlink:href="%23glyph-9765950-2" x="164.819392" y="150.519924"/>
</g>
<g style="fill:rgb(72.2%25,52.5%25,4.3%25);fill-opacity:1;">
<use xlink:href="%23glyph-9765950-5" x="169.088785" y="151.663904"/>
<use xlink:href="%23glyph-9765950-2" x="169.649022" y="151.814019"/>
</g>
<g style="fill:rgb(72.2%25,52.5%25,4.3%25);fill-opacity:1;">
<use xlink:href="%23glyph-9765950-6" x="173.918414" y="152.957999"/>
<use xlink:href="%23glyph-9765950-2" x="174.478651" y="153.108114"/>
</g>
<g style="fill:rgb(72.2%25,52.5%25,4.3%25);fill-opacity:1;">
<use xlink:href="%23glyph-9765950-7" x="178.748043" y="154.252094"/>
<use xlink:href="%23glyph-9765950-2" x="179.30828" y="154.402209"/>
</g>
<g style="fill:rgb(72.2%25,52.5%25,4.3%25);fill-opacity:1;">
<use xlink:href="%23glyph-9765950-8" x="183.577672" y="155.546189"/>
<use xlink:href="%23glyph-9765950-2" x="184.137909" y="155.696305"/>
</g>
<g style="fill:rgb(72.2%25,52.5%25,4.3%25);fill-opacity:1;">
<use xlink:href="%23glyph-9765950-9" x="188.407301" y="156.840285"/>
<use xlink:href="%23glyph-9765950-2" x="188.967538" y="156.9904"/>
</g>
<g style="fill:rgb(72.2%25,52.5%25,4.3%25);fill-opacity:1;">
<use xlink:href="%23glyph-9765950-10" x="193.23693" y="158.13438"/>
<use xlink:href="%23glyph-9765950-2" x="193.797167" y="158.284495"/>
</g>
<g style="fill:rgb(72.2%25,52.5%25,4.3%25);fill-opacity:1;">
<use xlink:href="%23glyph-9765950-1" x="197.506322" y="159.27836"/>
<use xlink:href="%23glyph-9765950-2" x="198.066559" y="159.428475"/>
<use xlink:href="%23glyph-9765950-2" x="198.626796" y="159.57859"/>
</g>
<g style="fill:rgb(72.2%25,52.5%25,4.3%25);fill-opacity:1;">
<use xlink:href="%23glyph-9765950-1" x="202.335952" y="160.572455"/>
<use xlink:href="%23glyph-9765950-1" x="202.896188" y="160.72257"/>
<use xlink:href="%23glyph-9765950-2" x="203.456425" y="160.872685"/>
</g>
<g style="fill:rgb(72.2%25,52.5%25,4.3%25);fill-opacity:1;">
<use xlink:href="%23glyph-9765950-1" x="207.165581" y="161.866551"/>
<use xlink:href="%23glyph-9765950-3" x="207.725818" y="162.016666"/>
<use xlink:href="%23glyph-9765950-2" x="208.286055" y="162.166781"/>
</g>
<g style="fill:rgb(72.2%25,52.5%25,4.3%25);fill-opacity:1;">
<use xlink:href="%23glyph-9765950-1" x="211.99521" y="163.160646"/>
<use xlink:href="%23glyph-9765950-4" x="212.555447" y="163.310761"/>
<use xlink:href="%23glyph-9765950-2" x="213.115684" y="163.460876"/>
</g>
<g style="fill:rgb(72.2%25,52.5%25,4.3%25);fill-opacity:1;">
<use xlink:href="%23glyph-9765950-1" x="216.824839" y="164.454741"/>
<use xlink:href="%23glyph-9765950-5" x="217.385076" y="164.604856"/>
<use xlink:href="%23glyph-9765950-2" x="217.945313" y="164.754971"/>
</g>
<g style="fill:rgb(72.2%25,52.5%25,4.3%25);fill-opacity:1;">
<use xlink:href="%23glyph-9765950-1" x="221.654468" y="165.748836"/>
<use xlink:href="%23glyph-9765950-6" x="222.214705" y="165.898951"/>
<use xlink:href="%23glyph-9765950-2" x="222.774942" y="166.049066"/>
</g>
<g style="fill:rgb(72.2%25,52.5%25,4.3%25);fill-opacity:1;">
<use xlink:href="%23glyph-9765950-1" x="226.484097" y="167.042931"/>
<use xlink:href="%23glyph-9765950-7" x="227.044334" y="167.193047"/>
<use xlink:href="%23glyph-9765950-2" x="227.604571" y="167.343162"/>
</g>
<g style="fill:rgb(72.2%25,52.5%25,4.3%25);fill-opacity:1;">
<use xlink:href="%23glyph-9765950-1" x="231.313726" y="168.337027"/>
<use xlink:href="%23glyph-9765950-8" x="231.873963" y="168.487142"/>
<use xlink:href="%23glyph-9765950-2" x="232.4342" y="168.637257"/>
</g>
<g style="fill:rgb(72.2%25,52.5%25,4.3%25);fill-opacity:1;">
<use xlink:href="%23glyph-9765950-1" x="236.143355" y="169.631122"/>
<use xlink:href="%23glyph-9765950-9" x="236.703592" y="169.781237"/>
<use xlink:href="%23glyph-9765950-2" x="237.263829" y="169.931352"/>
</g>
<g style="fill:rgb(72.2%25,52.5%25,4.3%25);fill-opacity:1;">
<use xlink:href="%23glyph-9765950-1" x="240.972985" y="170.925217"/>
<use xlink:href="%23glyph-9765950-10" x="241.533222" y="171.075332"/>
<use xlink:href="%23glyph-9765950-2" x="242.093459" y="171.225447"/>
</g>
<g style="fill:rgb(72.2%25,52.5%25,4.3%25);fill-opacity:1;">
<use xlink:href="%23glyph-9765950-3" x="245.802614" y="172.219312"/>
<use xlink:href="%23glyph-9765950-2" x="246.362851" y="172.369427"/>
<use xlink:href="%23glyph-9765950-2" x="246.923088" y="172.519542"/>
</g>
<g style="fill:rgb(72.2%25,52.5%25,4.3%25);fill-opacity:1;">
<use xlink:href="%23glyph-9765951-1" x="145.778876" y="152.874437"/>
<use xlink:href="%23glyph-9765951-2" x="145.628761" y="153.434674"/>
</g>
<g style="fill:rgb(72.2%25,52.5%25,4.3%25);fill-opacity:1;">
<use xlink:href="%23glyph-9765951-3" x="144.484781" y="157.704066"/>
<use xlink:href="%23glyph-9765951-2" x="144.334666" y="158.264303"/>
</g>
<g style="fill:rgb(72.2%25,52.5%25,4.3%25);fill-opacity:1;">
<use xlink:href="%23glyph-9765951-4" x="143.190686" y="162.533695"/>
<use xlink:href="%23glyph-9765951-2" x="143.040571" y="163.093932"/>
</g>
<g style="fill:rgb(72.2%25,52.5%25,4.3%25);fill-opacity:1;">
<use xlink:href="%23glyph-9765951-5" x="141.896591" y="167.363324"/>
<use xlink:href="%23glyph-9765951-2" x="141.746476" y="167.923561"/>
</g>
<g style="fill:rgb(72.2%25,52.5%25,4.3%25);fill-opacity:1;">
<use xlink:href="%23glyph-9765951-6" x="140.602495" y="172.192953"/>
<use xlink:href="%23glyph-9765951-2" x="140.45238" y="172.75319"/>
</g>
<g style="fill:rgb(72.2%25,52.5%25,4.3%25);fill-opacity:1;">
<use xlink:href="%23glyph-9765951-7" x="139.3084" y="177.022583"/>
<use xlink:href="%23glyph-9765951-2" x="139.158285" y="177.58282"/>
</g>
<g style="fill:rgb(72.2%25,52.5%25,4.3%25);fill-opacity:1;">
<use xlink:href="%23glyph-9765951-8" x="138.014305" y="181.852212"/>
<use xlink:href="%23glyph-9765951-2" x="137.86419" y="182.412449"/>
</g>
<g style="fill:rgb(72.2%25,52.5%25,4.3%25);fill-opacity:1;">
<use xlink:href="%23glyph-9765951-9" x="136.72021" y="186.681841"/>
<use xlink:href="%23glyph-9765951-2" x="136.570095" y="187.242078"/>
</g>
<g style="fill:rgb(72.2%25,52.5%25,4.3%25);fill-opacity:1;">
<use xlink:href="%23glyph-9765951-10" x="135.426115" y="191.51147"/>
<use xlink:href="%23glyph-9765951-2" x="135.276" y="192.071707"/>
</g>
<g style="fill:rgb(72.2%25,52.5%25,4.3%25);fill-opacity:1;">
<use xlink:href="%23glyph-9765951-1" x="134.282134" y="195.780862"/>
<use xlink:href="%23glyph-9765951-2" x="134.132019" y="196.341099"/>
<use xlink:href="%23glyph-9765951-2" x="133.981904" y="196.901336"/>
</g>
<g style="fill:rgb(72.2%25,52.5%25,4.3%25);fill-opacity:1;">
<use xlink:href="%23glyph-9765951-1" x="132.988039" y="200.610491"/>
<use xlink:href="%23glyph-9765951-1" x="132.837924" y="201.170728"/>
<use xlink:href="%23glyph-9765951-2" x="132.687809" y="201.730965"/>
</g>
<g style="fill:rgb(72.2%25,52.5%25,4.3%25);fill-opacity:1;">
<use xlink:href="%23glyph-9765951-1" x="131.693944" y="205.44012"/>
<use xlink:href="%23glyph-9765951-3" x="131.543829" y="206.000357"/>
<use xlink:href="%23glyph-9765951-2" x="131.393714" y="206.560594"/>
</g>
<g style="fill:rgb(72.2%25,52.5%25,4.3%25);fill-opacity:1;">
<use xlink:href="%23glyph-9765951-1" x="130.399849" y="210.269749"/>
<use xlink:href="%23glyph-9765951-4" x="130.249734" y="210.829986"/>
<use xlink:href="%23glyph-9765951-2" x="130.099619" y="211.390223"/>
</g>
<g style="fill:rgb(72.2%25,52.5%25,4.3%25);fill-opacity:1;">
<use xlink:href="%23glyph-9765951-1" x="129.105753" y="215.099379"/>
<use xlink:href="%23glyph-9765951-5" x="128.955638" y="215.659616"/>
<use xlink:href="%23glyph-9765951-2" x="128.805523" y="216.219853"/>
</g>
<g style="fill:rgb(72.2%25,52.5%25,4.3%25);fill-opacity:1;">
<use xlink:href="%23glyph-9765951-1" x="127.811658" y="219.929008"/>
<use xlink:href="%23glyph-9765951-6" x="127.661543" y="220.489245"/>
<use xlink:href="%23glyph-9765951-2" x="127.511428" y="221.049482"/>
</g>
<g style="fill:rgb(72.2%25,52.5%25,4.3%25);fill-opacity:1;">
<use xlink:href="%23glyph-9765951-1" x="126.517563" y="224.758637"/>
<use xlink:href="%23glyph-9765951-7" x="126.367448" y="225.318874"/>
<use xlink:href="%23glyph-9765951-2" x="126.217333" y="225.879111"/>
</g>
<g style="fill:rgb(72.2%25,52.5%25,4.3%25);fill-opacity:1;">
<use xlink:href="%23glyph-9765951-1" x="125.223468" y="229.588266"/>
<use xlink:href="%23glyph-9765951-8" x="125.073353" y="230.148503"/>
<use xlink:href="%23glyph-9765951-2" x="124.923238" y="230.70874"/>
</g>
<g style="fill:rgb(72.2%25,52.5%25,4.3%25);fill-opacity:1;">
<use xlink:href="%23glyph-9765951-1" x="123.929373" y="234.417895"/>
<use xlink:href="%23glyph-9765951-9" x="123.779258" y="234.978132"/>
<use xlink:href="%23glyph-9765951-2" x="123.629142" y="235.538369"/>
</g>
<g style="fill:rgb(72.2%25,52.5%25,4.3%25);fill-opacity:1;">
<use xlink:href="%23glyph-9765951-1" x="122.635277" y="239.247524"/>
<use xlink:href="%23glyph-9765951-10" x="122.485162" y="239.807761"/>
<use xlink:href="%23glyph-9765951-2" x="122.335047" y="240.367998"/>
</g>
<g style="fill:rgb(72.2%25,52.5%25,4.3%25);fill-opacity:1;">
<use xlink:href="%23glyph-9765951-3" x="121.341182" y="244.077153"/>
<use xlink:href="%23glyph-9765951-2" x="121.191067" y="244.63739"/>
<use xlink:href="%23glyph-9765951-2" x="121.040952" y="245.197627"/>
</g>
<g style="fill:rgb(72.2%25,52.5%25,4.3%25);fill-opacity:1;">
<use xlink:href="%23glyph-9765952-1" x="233.820201" y="185.597857"/>
</g>
<g style="fill:rgb(72.2%25,52.5%25,4.3%25);fill-opacity:1;">
<use xlink:href="%23glyph-9765953-1" x="110.838463" y="227.801521"/>
</g>
<g style="fill:rgb(100%25,100%25,100%25);fill-opacity:1;">
<use xlink:href="%23glyph-9765952-1" x="155.598791" y="149.109351"/>
</g>
<g style="fill:rgb(100%25,100%25,100%25);fill-opacity:1;">
<use xlink:href="%23glyph-9765953-1" x="144.538581" y="147.107505"/>
</g>
<path style="fill:none;stroke-width:0.25;stroke-linecap:butt;stroke-linejoin:miter;stroke:rgb(100%25,100%25,100%25);stroke-opacity:1;stroke-miterlimit:10;" d="M 150.964844 150.257812 C 150.824219 150.792969 150.273438 151.109375 149.742188 150.964844 C 149.207031 150.824219 148.890625 150.273438 149.035156 149.742188 C 149.175781 149.207031 149.726562 148.890625 150.257812 149.035156 C 150.792969 149.175781 151.109375 149.726562 150.964844 150.257812 Z M 150.964844 150.257812 "/>
<path style=" stroke:none;fill-rule:nonzero;fill:rgb(100%25,100%25,100%25);fill-opacity:0.5;" d="M 150.964844 150.257812 C 150.824219 150.792969 150.273438 151.109375 149.742188 150.964844 C 149.207031 150.824219 148.890625 150.273438 149.035156 149.742188 C 149.175781 149.207031 149.726562 148.890625 150.257812 149.035156 C 150.792969 149.175781 151.109375 149.726562 150.964844 150.257812 Z M 150.964844 150.257812 "/>
</g>
</svg>)
If you want to obtain the paths and coordinates for use elsewhere, you can use the log=true function, which sends the commands to the REPL as well:
placeeps("/tmp/linux.eps", log=true)

# start EPS import
gsave()
setgray(1.0)
move(Point(70.801, -6.0))
line(Point(429.199, -6.0))
curve(Point(471.617, -6.0), Point(506.0, 28.383), Point(506.0, 70.801))
line(Point(506.0, 429.199))
curve(Point(506.0, 471.617), Point(471.617, 506.0), Point(429.199, 506.0))
line(Point(70.801, 506.0))
curve(Point(28.383, 506.0), Point(-6.0, 471.617), Point(-6.0, 429.199))
line(Point(-6.0, 70.801))
curve(Point(-6.0, 28.383), Point(28.383, -6.0), Point(70.801, -6.0))
closepath()
move(Point(70.801, -6.0))
fillpath()
...
Once you have a sequence of Luxor commands, you can edit them into new creations:

Placing an image matrix
You can use placeimage to put pixel images on a drawing.
This example uses noise to define the RGB values in a matrix of ARGB32 color values:
D = 600
mat = [Luxor.ARGB32(
    noise(0.01r, 0.01c),
    noise(0.1r, 0.02c),
    noise(0.1r, 0.01c)) for r in 1:D, c in 1:D]

@drawsvg begin
    placeimage(mat, centered=true)
    fontsize(80)
    sethue("white")
    setopacity(0.5)
    text("woah", halign=:center)
end D D÷2"/>
<g style="fill:rgb(100%25,100%25,100%25);fill-opacity:0.5;">
<use xlink:href="%23glyph-5143640-1" x="203.44" y="150"/>
<use xlink:href="%23glyph-5143640-2" x="266.48" y="150"/>
<use xlink:href="%23glyph-5143640-3" x="311.92" y="150"/>
<use xlink:href="%23glyph-5143640-4" x="351.84" y="150"/>
</g>
</g>
</svg>)
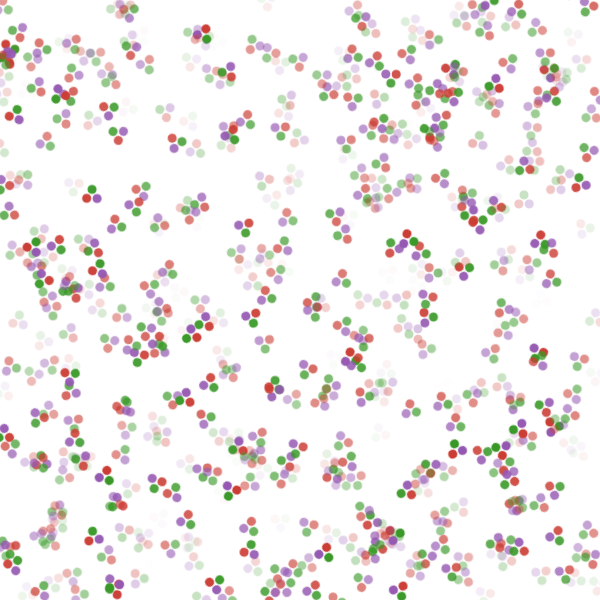
The next example saves vector graphics into an image matrix, then places that matrix at random on another drawing.
using Luxor

mat = @imagematrix begin
    juliacircles(6)
end 40 40

@draw begin
    for i in 1:500
        pos = rand(BoundingBox())
        @layer begin
            translate(pos)
            rotate(rand() * 2π)
            placeimage(mat, centered = rand(Bool))
        end
    end
end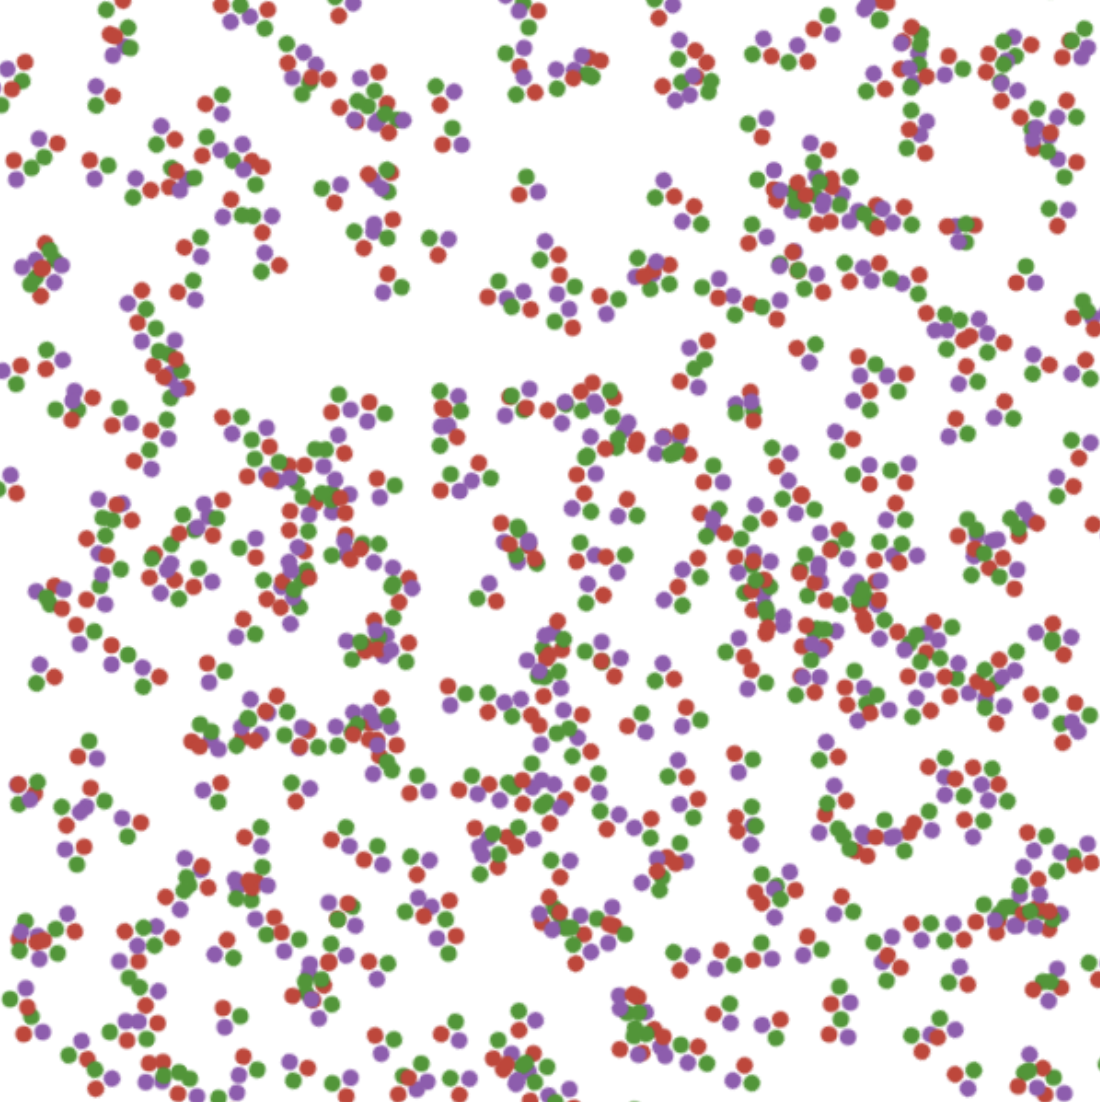
placeimage can also take in an optional argument alpha to change the opacity of the image matrix.
Clipping images
You can clip images. The following script repeatedly places the image using a circle to define a clipping path:
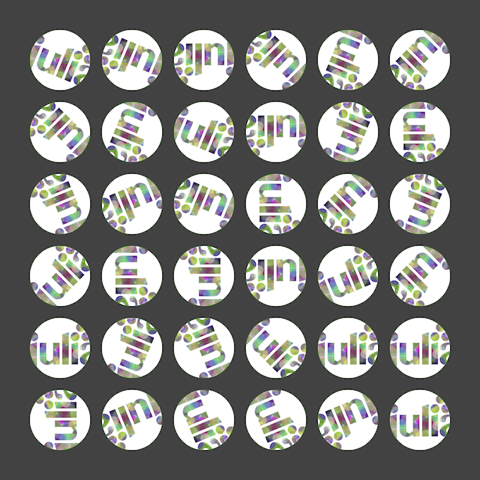
using Luxor

width, height = 4000, 4000
margin = 500

fname = "test-image.pdf"
Drawing(width, height, fname)
origin()
background("grey25")

setline(5)
sethue("green")

image = readpng(dirname(@__FILE__) * "../assets/figures/julia-logo-mask.png")

w = image.width
h = image.height

pagetiles = Tiler(width, height, 7, 9)
tw = pagetiles.tilewidth/2
for (pos, n) in pagetiles
    circle(pos, tw, :stroke)
    circle(pos, tw, :clip)
    gsave()
    translate(pos)
    scale(.95, .95)
    rotate(rand(0.0:π/8:2π))
    placeimage(image, O, centered=true)
    grestore()
    clipreset()
end

finish()
Transforming images
You can transform images by setting the current matrix, either with scale and rotate and similar, or by modifying it directly. This code scales and rotates an image made in an earlier chapter of this document around in a circle:
img = readpng(dirname(dirname(pathof(Luxor))) * "/docs/src/assets/figures/textoutlines.png")
w = img.width
h = img.height
for θ in 0:π/6:2π-π/6
    gsave()
    scale(.4, .4)
    rotate(θ)
    translate(300, 0)
    placeimage(img, -w/2, -h/2, 0.9)
    grestore()
end
Combining images and vector graphics
You sometimes want to combine vector graphics and images, for example, to annotate them with text or vector graphics.
There are two ways you can do this:
by adding the image with
placeimage()and then drawing vector graphics on top.by opening the image as a drawing, and adding vector graphics into the image.
The things to be aware of are mostly to do with coordinates and transforms.
Adding graphics on top
In this example, we'll annotate a PNG file.
image = readpng("../assets/figures/julia-logo-mask.png")

w = image.width
h = image.height

# create a drawing surface of the same size

fname = "../assets/figures/drawing_on_images.png"
Drawing(w, h, fname)

# place the image on the Drawing - it's positioned by its top/left corner

placeimage(image, 0, 0)

# now you can annotate the image. The (0/0) is at the top left.

sethue("red")
setline(1)
fontsize(16)
circle(Point(150, 50), 2, :fill)
label("(150/50)", :NE, Point(150, 50), leader=true, offset=25)

arrow(Point(w/2, 90), Point(0, 90))
arrow(Point(w/2, 90), Point(w, 90))
text("width $w", Point(w/2, 70), halign=:center)

# to divide up the image into rectangular areas and number them,
# temporarily position the axes at the center:

@layer begin
  setline(0.5)
  sethue("green")
  fontsize(12)
  translate(w/2, h/2)
  tiles = Tiler(w, h, 8, 8, margin=0)
  for (pos, n) in tiles
      box(pos, tiles.tilewidth, tiles.tileheight, :stroke)
      text(string(n-1), pos, halign=:center)
  end
end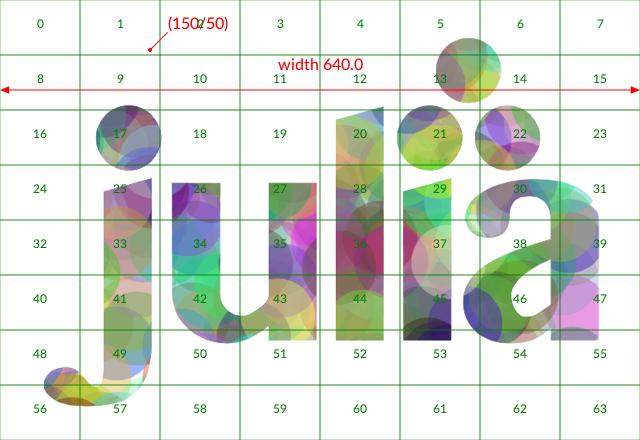
Adding text to transformed placed images
The above approach works well, but suppose you want to locate the working origin at the lower left of the image, i.e. you want all coordinates to be relative to the bottom left corner of the image?
To do this, use translate and transform to modify the drawing space:
image = readpng("../assets/figures/julia-logo-mask.png")
w = image.width
h = image.height
fname = "../assets/figures/drawing_on_images_2.png"
Drawing(w, h, fname)
placeimage(image, 0, 0)

# Move the axes to the bottom:

translate(0, h)

# and reflect in the x-axis

transform([1 0 0 -1 0 0])

# now 0/0 is at the bottom left corner, and 100/100 is up and to the right.

sethue("blue")
arrow(Point(200, 300), Point(160, 300))

# However, don't draw text while flipped, because it will be reversed!

fontsize(20)
sethue("black")
text("Oh no!", Point(30, 250))

# To work around this, define a text function
# that flips the workspace over the x-axis just for the text:

function textoverlay(t, pos; kwargs...)
    @layer begin
        translate(pos)
        transform([1 0 0 -1 0 0])
        text(t, O; kwargs...)
    end
end

textoverlay("a tittle!", Point(200, 300), halign=:left, valign=:middle)
textoverlay("0/0", O)
arrow(Point(130, 400), Point(130, 340))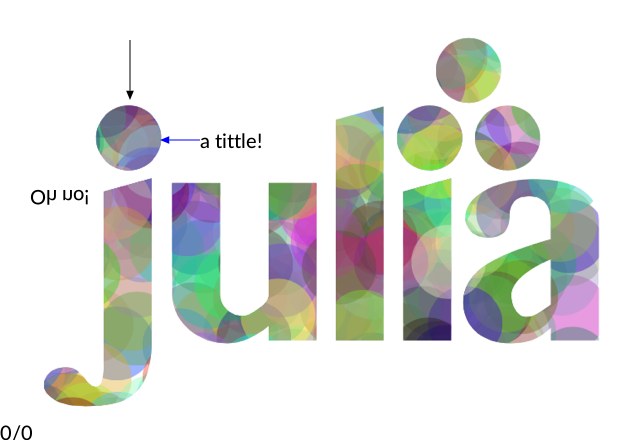
Opening the image as drawing
An alternative way to work with images is to open the image as a drawing. Let's open the well-known mandrill image in Luxor. (I'll call him Marvin, because I couldn't find out whether or not the model had a name, but I think he should have one.)
using Luxor, Colors, Images, TestImages

marvin = testimage("mandrill")
M = Luxor.Colors.ARGB32.(marvin)
Drawing(M)
The current drawing is now a 512 × 512 array, where each pixel is an ARGB32 (an unsigned 32-bit integer holding 4 8-bit vaalues).
Marvin's right eye (on the left side of the drawing) is located at about 60 rows down, 175 columns across. Let's fill in his pupil with a white square:
M[55:65, 170:180] .= colorant"white"
M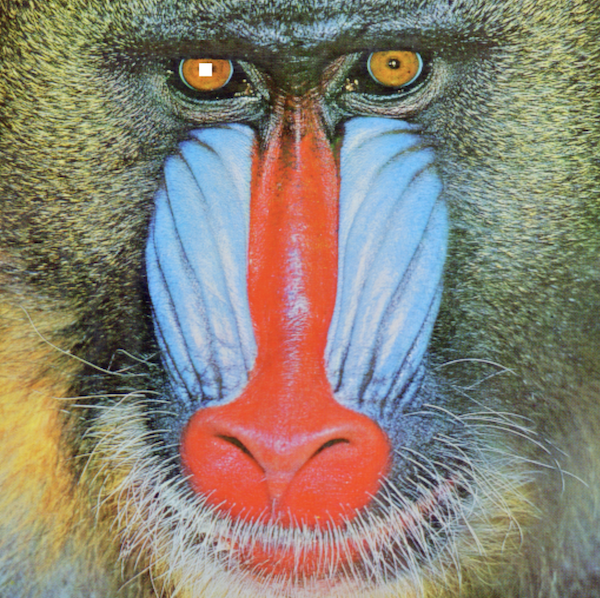
Using M on its own should show the image in your notebook or code editor (but not the REPL). If you want to save it, using the standard Images.jl functions.
We can use these indices as x and y coordinates, since the drawing origin is also currently at the top left.
sethue("white")
circle(Point(60, 175), 20, :stroke)
M
If we want to draw, say, a 10 by 10 numbered grid overlay on top of Marvin, and highlight four numbered cells, it's easier to just add a transform() function that flips the x/cols and y/rows convention, then create a table centered at the center of the drawing:
fontsize(15)
sethue("white")
setline(1)
transform([0 1 1 0 0 0])
cells = Table(10, 10, 512 / 10, 512 / 10, Point(512 / 2, 512 / 2))
for (pos, n) in cells
    text(string(n), pos, halign = :center, valign = :middle)
    box(pos, 512 / 10, 512 / 10, :stroke)
end
setline(5)
highlightcells(cells, collect(1:100)[[2, 4, 35, 69]], :stroke,
    color = colorant"blue")
M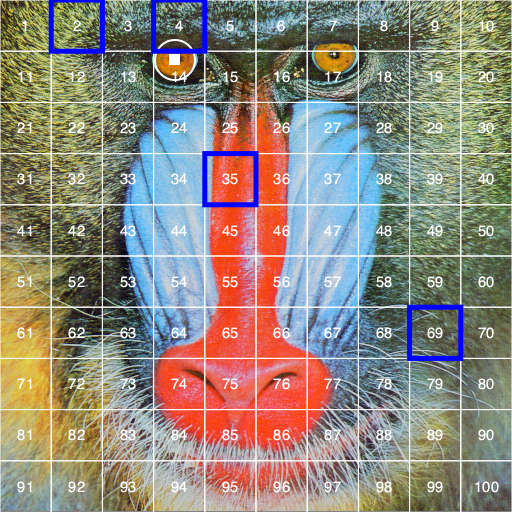
Image compositing
You should be using Images.jl for most tasks involving image editing. But if you just need to composite images together, you can use the blending modes provided by setmode.
img = readpng("../assets/figures/textoutlines.png")
w = img.width
h = img.height

placeimage(img, -w/2, -h/2, .5)
setmode("saturate")
translate(50, 0)
placeimage(img, -w/2, -h/2, .5)