Simple graphics
In Luxor, there are different ways of working with graphical items. Some, such as lines, rectangles and circles, are drawn immediately (ie placed on the drawing and then "forgotten"). Others can be constructed and then converted to lists of points for further processing. For these, watch out for a vertices=true option.
Rectangles and boxes
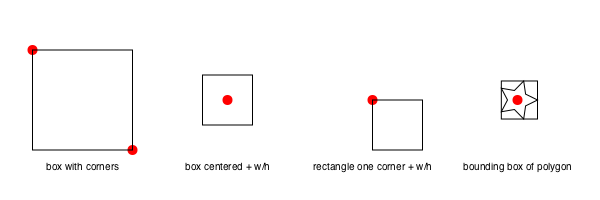
The simple rectangle and box shapes can be made in different ways.
rulers()
sethue("red")
rect(O, 100, 100, :stroke)
sethue("blue")
box(O, 100, 100, :stroke)
┌ Warning: The function `cfunction` is now written as a macro `@cfunction`.
│ caller = get_stream_callback at Cairo.jl:145 [inlined]
└ @ Core Cairo.jl:145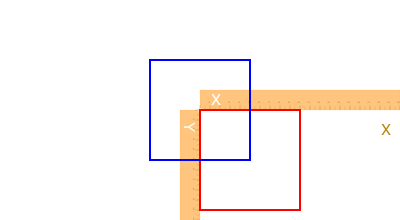
rect() rectangles are positioned by a corner, but a box made with box() can either be defined by its center and dimensions, or by two opposite corners.
If you want the coordinates of the corners of a box, rather than draw one immediately, use:
box(centerpoint, width, height, vertices=true)or
box(corner1, corner2, vertices=true)Luxor.rect — Function.rect(xmin, ymin, w, h, action)Create a rectangle with one corner at (xmin/ymin) with width w and height h and then do an action.
See box() for more ways to do similar things, such as supplying two opposite corners, placing by centerpoint and dimensions.
rect(cornerpoint, w, h, action)Create a rectangle with one corner at cornerpoint with width w and height h and do an action.
Luxor.box — Function.box(cornerpoint1, cornerpoint2, action=:nothing; vertices=false)Create a rectangle between two points and do an action. Use vertices=true to return an array of the four corner points rather than draw the box.
box(points::AbstractArray, action=:nothing)Create a box/rectangle using the first two points of an array of Points to defined opposite corners.
box(pt::Point, width, height, action=:nothing; vertices=false)Create a box/rectangle centered at point pt with width and height. Use vertices=true to return an array of the four corner points rather than draw the box.
box(x, y, width, height, action=:nothing)Create a box/rectangle centered at point x/y with width and height.
box(x, y, width, height, cornerradius, action=:nothing)Create a box/rectangle centered at point x/y with width and height. Round each corner by cornerradius.
box(t::Table, r::Int, c::Int, action::Symbol=:nothing)Draw a box in table t at row r and column c.
box(t::Table, cellnumber::Int, action::Symbol=:nothing; vertices=false)Draw box cellnumber in table t.
box(bbox::BoundingBox, :action)Make a box using the bounds in bbox.
For regular polygons, see the next section on Polygons.
Circles and ellipses
There are various ways to make circles, including by center and radius, or passing through two points:
p1 = O
p2 = Point(100, 0)
sethue("red")
circle(p1, 40, :fill)
sethue("green")
circle(p1, p2, :stroke)
sethue("black")
arrow(O, Point(0, -40))
map(p -> circle(p, 4, :fill), [p1, p2])┌ Warning: The function `cfunction` is now written as a macro `@cfunction`.
│ caller = get_stream_callback at Cairo.jl:145 [inlined]
└ @ Core Cairo.jl:145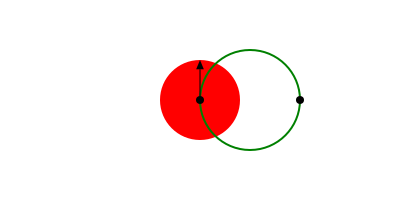
Or passing through three points. The center3pts() function returns the center position and radius of a circle passing through three points:
sethue("black")
p1 = Point(0, -50)
p2 = Point(100, 0)
p3 = Point(0, 65)
map(p -> circle(p, 4, :fill), [p1, p2, p3])
sethue("orange")
circle(center3pts(p1, p2, p3)..., :stroke)┌ Warning: The function `cfunction` is now written as a macro `@cfunction`.
│ caller = get_stream_callback at Cairo.jl:145 [inlined]
└ @ Core Cairo.jl:145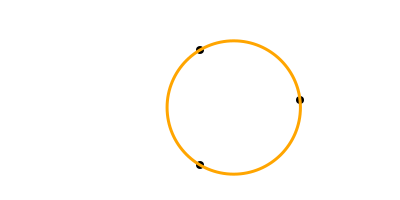
Luxor.circle — Function.circle(x, y, r, action=:nothing)Make a circle of radius r centered at x/y.
action is one of the actions applied by do_action, defaulting to :nothing. You can also use ellipse() to draw circles and place them by their centerpoint.
circle(pt, r, action=:nothing)Make a circle centered at pt.
circle(pt1::Point, pt2::Point, action=:nothing)Make a circle that passes through two points that define the diameter:
Luxor.center3pts — Function.center3pts(a::Point, b::Point, c::Point)Find the radius and center point for three points lying on a circle.
returns (centerpoint, radius) of a circle. Then you can use circle() to place a circle, or arc() to draw an arc passing through those points.
If there's no such circle, then you'll see an error message in the console and the function returns (Point(0,0), 0).
With ellipse() you can place ellipses (and circles) by defining the center point and the width and height.
tiles = Tiler(500, 300, 5, 5)
width = 20
height = 25
for (pos, n) in tiles
randomhue()
ellipse(pos, width, height, :fill)
sethue("black")
label = string(round(width/height, digits=2))
textcentered(label, pos.x, pos.y + 25)
width += 2
end┌ Warning: Deprecated syntax `implicit assignment to global variable `width``.
│ Use `global width` instead.
└ @ nothing none:0
┌ Warning: The function `cfunction` is now written as a macro `@cfunction`.
│   caller = get_stream_callback at Cairo.jl:145 [inlined]
└ @ Core Cairo.jl:145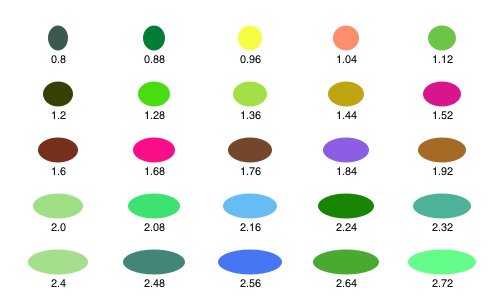
ellipse() can also construct polygons that are approximations to ellipses. You supply two focal points and a length which is the sum of the distances of a point on the perimeter to the two focii.
fontface("Menlo")
f1 = Point(-100, 0)
f2 = Point(100, 0)
circle.([f1, f2], 3, :fill)
epoly = ellipse(f1, f2, 250, vertices=true)
poly(epoly, :stroke, close=true)
pt = epoly[rand(1:end)]
poly([f1, pt, f2], :stroke)
label("f1", :W, f1, offset=10)
label("f2", :E, f2, offset=10)
label(string(round(distance(f1, pt), digits=1)), :SE, midpoint(f1, pt))
label(string(round(distance(pt, f2), digits=1)), :SW, midpoint(pt, f2))
label("ellipse(f1, f2, 250)", :S, Point(0, 75))┌ Warning: The function `cfunction` is now written as a macro `@cfunction`.
│ caller = get_stream_callback at Cairo.jl:145 [inlined]
└ @ Core Cairo.jl:145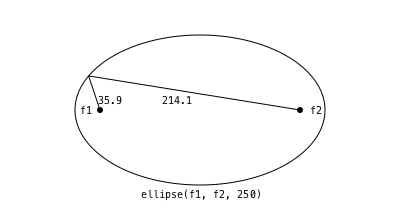
The advantage of this method is that there's a vertices=true|false option, allowing further scope for polygon manipulation.
f1 = Point(-100, 0)
f2 = Point(100, 0)
ellipsepoly = ellipse(f1, f2, 170, :none, vertices=true)
[ begin
setgray(rescale(c, 150, 1, 0, 1))
poly(offsetpoly(ellipsepoly, c), close=true, :fill);
rotate(pi/20)
end
for c in 150:-10:1 ]┌ Warning: The function `cfunction` is now written as a macro `@cfunction`.
│ caller = get_stream_callback at Cairo.jl:145 [inlined]
└ @ Core Cairo.jl:145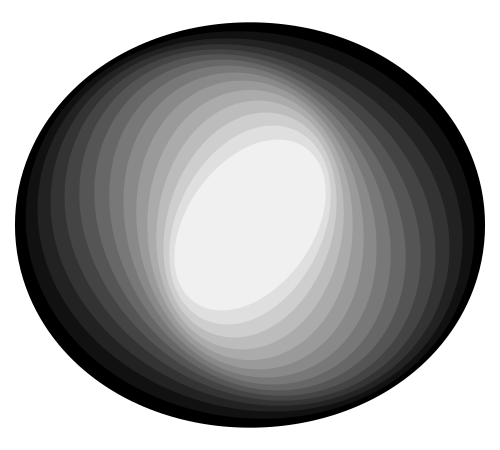
Luxor.ellipse — Function.ellipse(xc, yc, w, h, action=:none)Make an ellipse, centered at xc/yc, fitting in a box of width w and height h.
ellipse(cpt, w, h, action=:none)Make an ellipse, centered at point c, with width w, and height h.
ellipse(focus1::Point, focus2::Point, k, action=:none;
stepvalue=pi/100,
vertices=false,
reversepath=false)Build a polygon approximation to an ellipse, given two points and a distance, k, which is the sum of the distances to the focii of any points on the ellipse (or the shortest length of string required to go from one focus to the perimeter and on to the other focus).
circlepath() constructs a circular path from Bézier curves, which allows you to use circles as paths.
setline(4)
tiles = Tiler(600, 250, 1, 5)
for (pos, n) in tiles
randomhue()
circlepath(pos, tiles.tilewidth/2, :path)
newsubpath()
circlepath(pos, rand(5:tiles.tilewidth/2 - 1), :fill, reversepath=true)
end┌ Warning: The function `cfunction` is now written as a macro `@cfunction`.
│ caller = get_stream_callback at Cairo.jl:145 [inlined]
└ @ Core Cairo.jl:145
Luxor.circlepath — Function.circlepath(center::Point, radius, action=:none;
reversepath=false,
kappa = 0.5522847498307936)Draw a circle using Bézier curves.
The magic value, kappa, is 4.0 * (sqrt(2.0) - 1.0) / 3.0.
More curved shapes: sectors, spirals, and squircles
A sector (technically an "annular sector") has an inner and outer radius, as well as start and end angles.
sethue("tomato")
sector(50, 90, pi/2, 0, :fill)
sethue("olive")
sector(Point(O.x + 200, O.y), 50, 90, 0, pi/2, :fill)┌ Warning: The function `cfunction` is now written as a macro `@cfunction`.
│ caller = get_stream_callback at Cairo.jl:145 [inlined]
└ @ Core Cairo.jl:145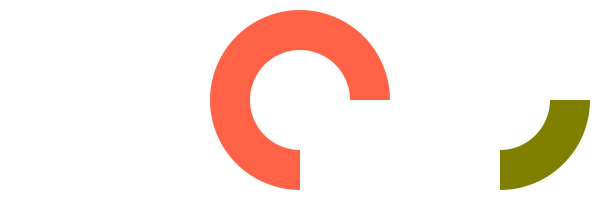
You can also supply a value for a corner radius. The same sector is drawn but with rounded corners.
sethue("tomato")
sector(50, 90, pi/2, 0, 15, :fill)
sethue("olive")
sector(Point(O.x + 200, O.y), 50, 90, 0, pi/2, 15, :fill)┌ Warning: The function `cfunction` is now written as a macro `@cfunction`.
│ caller = get_stream_callback at Cairo.jl:145 [inlined]
└ @ Core Cairo.jl:145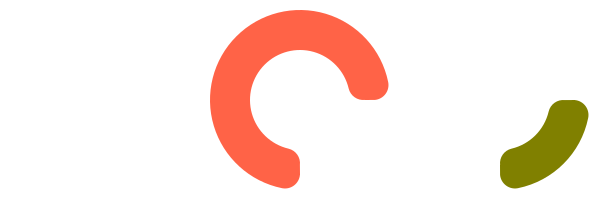
Luxor.sector — Function.sector(centerpoint::Point, innerradius, outerradius, startangle, endangle, action:none)Draw an annular sector centered at centerpoint.
sector(innerradius::Real, outerradius::Real, startangle::Real, endangle::Real,
action::Symbol=:none)Draw an annular sector centered at the origin.
sector(centerpoint::Point, innerradius, outerradius, startangle, endangle,
cornerradius, action:none)Draw an annular sector with rounded corners, basically a bent sausage shape, centered at centerpoint.
TODO: The results aren't 100% accurate at the moment. There are small discontinuities where the curves join.
The cornerradius is reduced from the supplied value if neceesary to prevent overshoots.
sector(innerradius::Real, outerradius::Real, startangle::Real, endangle::Real,
cornerradius::Real, action::Symbol=:none)Draw an annular sector with rounded corners, centered at the current origin.
A pie (or wedge) has start and end angles.
pie(0, 0, 100, pi/2, pi, :fill)┌ Warning: The function `cfunction` is now written as a macro `@cfunction`.
│ caller = get_stream_callback at Cairo.jl:145 [inlined]
└ @ Core Cairo.jl:145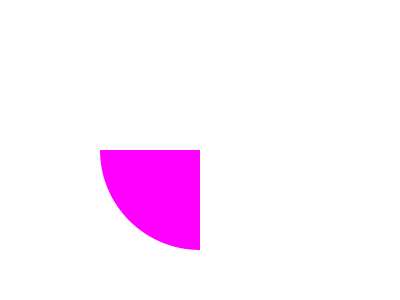
Luxor.pie — Function.pie(x, y, radius, startangle, endangle, action=:none)Draw a pie shape centered at x/y. Angles start at the positive x-axis and are measured clockwise.
pie(centerpoint, radius, startangle, endangle, action=:none)Draw a pie shape centered at centerpoint.
Angles start at the positive x-axis and are measured clockwise.
pie(radius, startangle, endangle, action=:none)Draw a pie shape centered at the origin
To construct spirals, use the spiral() function. These can be drawn directly, or used as polygons. The default is to draw Archimedes (non-logarithmic) spirals.
spiraldata = [
(-2, "Lituus", 50),
(-1, "Hyperbolic", 100),
( 1, "Archimedes", 1),
( 2, "Fermat", 5)]
grid = GridRect(O - (200, 0), 130, 50)
for aspiral in spiraldata
@layer begin
translate(nextgridpoint(grid))
spiral(last(aspiral), first(aspiral), period=20pi, :stroke)
label(aspiral[2], :S, offset=100)
end
end┌ Warning: The function `cfunction` is now written as a macro `@cfunction`.
│ caller = get_stream_callback at Cairo.jl:145 [inlined]
└ @ Core Cairo.jl:145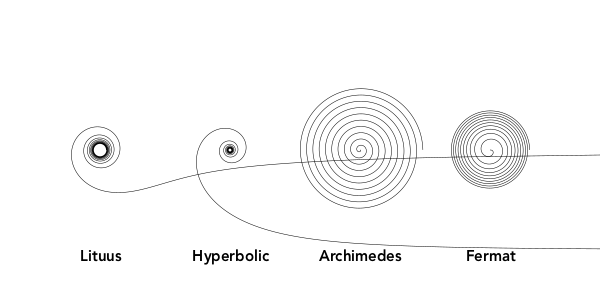
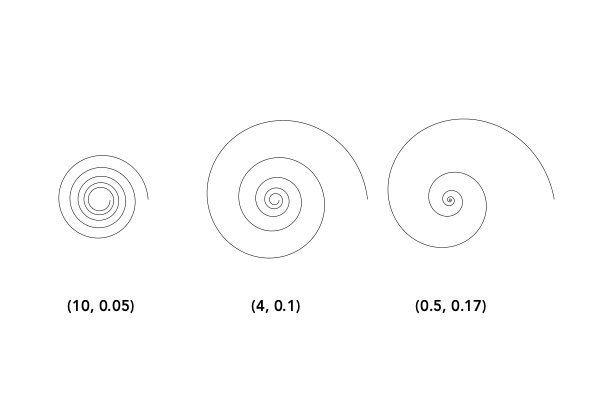
Use the log=true option to draw logarithmic (Bernoulli or Fibonacci) spirals.
spiraldata = [
(10, 0.05),
(4, 0.10),
(0.5, 0.17)]
grid = GridRect(O - (200, 0), 175, 50)
for aspiral in spiraldata
@layer begin
translate(nextgridpoint(grid))
spiral(first(aspiral), last(aspiral), log=true, period=10pi, :stroke)
label(string(aspiral), :S, offset=100)
end
end┌ Warning: The function `cfunction` is now written as a macro `@cfunction`.
│ caller = get_stream_callback at Cairo.jl:145 [inlined]
└ @ Core Cairo.jl:145Modify the stepby and period parameters to taste, or collect the vertices for further processing.
Luxor.spiral — Function.spiral(a, b, action::Symbol=:none;
stepby = 0.01,
period = 4pi,
vertices = false,
log=false)Make a spiral. The two primary parameters a and b determine the start radius, and the tightness.
For linear spirals (log=false), b values are:
lituus: -2
hyperbolic spiral: -1
Archimedes' spiral: 1
Fermat's spiral: 2For logarithmic spirals (log=true):
golden spiral: b = ln(phi)/ (pi/2) (about 0.30)Values of b around 0.1 produce tighter, staircase-like spirals.
A squircle is a cross between a square and a circle. You can adjust the squariness and circularity of it to taste by supplying a value for the root (keyword rt):
setline(2)
tiles = Tiler(600, 250, 1, 3)
for (pos, n) in tiles
sethue("lavender")
squircle(pos, 80, 80, rt=[0.3, 0.5, 0.7][n], :fillpreserve)
sethue("grey20")
strokepath()
textcentered("rt = $([0.3, 0.5, 0.7][n])", pos)
end┌ Warning: The function `cfunction` is now written as a macro `@cfunction`.
│ caller = get_stream_callback at Cairo.jl:145 [inlined]
└ @ Core Cairo.jl:145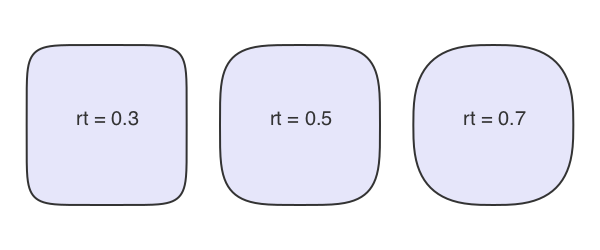
Luxor.squircle — Function.squircle(center::Point, hradius, vradius, action=:none;
rt = 0.5, stepby = pi/40, vertices=false)Make a squircle or superellipse (basically a rectangle with rounded corners). Specify the center position, horizontal radius (distance from center to a side), and vertical radius (distance from center to top or bottom):
The root (rt) option defaults to 0.5, and gives an intermediate shape. Values less than 0.5 make the shape more rectangular. Values above make the shape more round. The horizontal and vertical radii can be different.
To draw a simple rounded rectangle, supply a corner radius:
setline(4)
box(O, 200, 150, 10, :stroke)┌ Warning: The function `cfunction` is now written as a macro `@cfunction`.
│ caller = get_stream_callback at Cairo.jl:145 [inlined]
└ @ Core Cairo.jl:145
Or you could smooth the corners of a box, like so:
setline(4)
polysmooth(box(O, 200, 150, vertices=true), 10, :stroke)┌ Warning: The function `cfunction` is now written as a macro `@cfunction`.
│ caller = get_stream_callback at Cairo.jl:145 [inlined]
└ @ Core Cairo.jl:145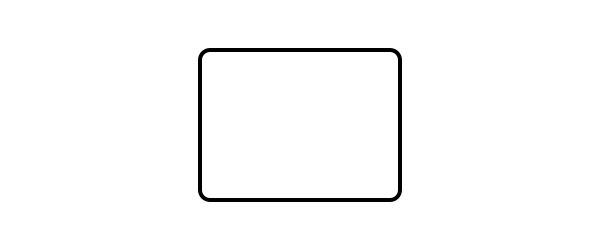
Paths and positions
A path is a sequence of lines and curves. You can add lines and curves to the current path, then use closepath() to join the last point to the first.
A path can have subpaths, created withnewsubpath(), which can form holes.
There is a 'current position' which you can set with move(), and can use implicitly in functions like line(), rline(), text(), arc() and curve().
Luxor.move — Function.move(x, y)
move(pt)Move to a point.
Luxor.rmove — Function.rmove(x, y)Move by an amount from the current point. Move relative to current position by x and y:
Move relative to current position by the pt's x and y:
rmove(pt)Luxor.newpath — Function.newpath()Create a new path. This is Cairo's new_path() function.
Luxor.newsubpath — Function.newsubpath()Add a new subpath to the current path. This is Cairo's new_sub_path() function. It can be used for example to make holes in shapes.
Luxor.closepath — Function.closepath()Close the current path. This is Cairo's close_path() function.
Lines
Use line() and rline() to draw straight lines. line(pt1, pt2, action) draws a line between two points. line(pt) adds a line to the current path going from the current position to the point. rline(pt) adds a line relative to the current position.
Luxor.line — Function.line(x, y)
line(x, y)
line(pt)Create a line from the current position to the x/y position.
line(pt1::Point, pt2::Point, action=:nothing)Make a line between two points, pt1 and pt2 and do an action.
Luxor.rline — Function.rline(x, y)
rline(x, y)
rline(pt)Create a line relative to the current position to the x/y position.
You can use rule() to draw a line across the entire drawing through a point, at an angle to the current x-axis.
y = 10
for x in logspace(0, 2.75, 40)
circle(Point(x, y), 2, :fill)
rule(Point(x, y), -pi/2)
y += 2
end┌ Warning: Deprecated syntax `implicit assignment to global variable `y``.
│ Use `global y` instead.
└ @ nothing none:0
┌ Warning: `logspace(start, stop, n; base=10)` is deprecated, use `base .^ range(start, stop=stop, length=n)` instead.
│ caller = top-level scope at none:0 [inlined]
└ @ Core none:0
┌ Warning: The function `cfunction` is now written as a macro `@cfunction`.
│   caller = get_stream_callback at Cairo.jl:145 [inlined]
└ @ Core Cairo.jl:145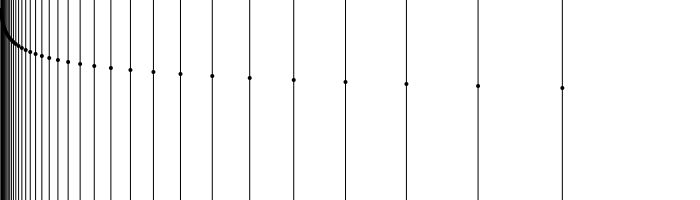
Luxor.rule — Function.rule(pos::Point, theta=0.0)Draw a line across the entire drawing passing through pos, at an angle of theta to the x-axis. Returns the two points.
The end points are not calculated exactly, they're just a long way apart.
Arcs and curves
There are a few standard arc-drawing commands, such as curve(), arc(), carc(), and arc2r(). Because these are often used when building complex paths, they usually add arc sections to the current path. To construct a sequence of lines and arcs, use the :path action.
curve() constructs Bézier curves from control points:
setline(.5)
pt1 = Point(0, -125)
pt2 = Point(200, 125)
pt3 = Point(200, -125)

label.(string.(["O", "control point 1", "control point 2", "control point 3"]),
    :e,
    [O, pt1, pt2, pt3])

sethue("red")
map(p -> circle(p, 4, :fill), [O, pt1, pt2, pt3])

line(O, pt1, :stroke)
line(pt2, pt3, :stroke)

sethue("black")
setline(3)

# start a path
move(O)
curve(pt1, pt2, pt3) #  add to current path
strokepath()
┌ Warning: The function `cfunction` is now written as a macro `@cfunction`.
│ caller = get_stream_callback at Cairo.jl:145 [inlined]
└ @ Core Cairo.jl:145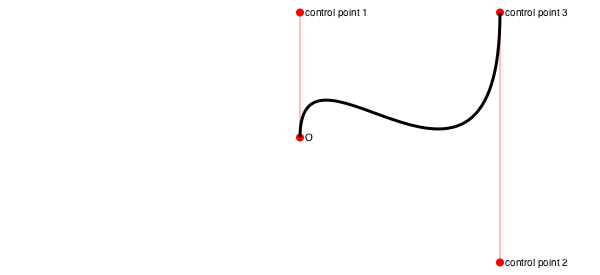
arc2r() draws a circular arc centered at a point that passes through two other points:
tiles = Tiler(700, 200, 1, 6)
for (pos, n) in tiles
    c1, pt2, pt3 = ngon(pos, rand(10:50), 3, rand(0:pi/12:2pi), vertices=true)
    sethue("black")
    map(pt -> circle(pt, 4, :fill), [c1, pt3])
    sethue("red")
    circle(pt2, 4, :fill)
    randomhue()
    arc2r(c1, pt2, pt3, :stroke)
end
┌ Warning: The function `cfunction` is now written as a macro `@cfunction`.
│ caller = get_stream_callback at Cairo.jl:145 [inlined]
└ @ Core Cairo.jl:145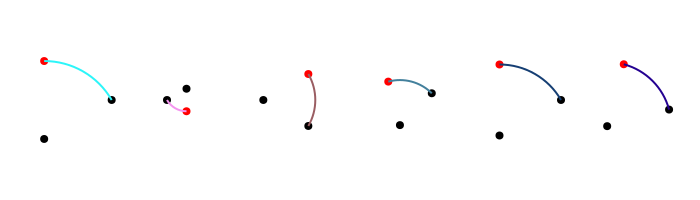
Luxor.arc — Function.arc(xc, yc, radius, angle1, angle2, action=:nothing)Add an arc to the current path from angle1 to angle2 going clockwise, centered at xc, yc.
Angles are defined relative to the x-axis, positive clockwise.
arc(centerpoint::Point, radius, angle1, angle2, action=:nothing)Add an arc to the current path from angle1 to angle2 going clockwise, centered at centerpoint.
Luxor.arc2r — Function. arc2r(c1::Point, p2::Point, p3::Point, action=:nothing)Add a circular arc centered at c1 that starts at p2 and ends at p3, going clockwise, to the current path.
c1-p2 really determines the radius. If p3 doesn't lie on the circular path, it will be used only as an indication of the arc's length, rather than its position.
Luxor.carc — Function.carc(xc, yc, radius, angle1, angle2, action=:nothing)Add an arc to the current path from angle1 to angle2 going counterclockwise, centered at xc/yc.
Angles are defined relative to the x-axis, positive clockwise.
carc(centerpoint::Point, radius, angle1, angle2, action=:nothing)Add an arc centered at centerpoint to the current path from angle1 to angle2, going counterclockwise.
Luxor.carc2r — Function.carc2r(c1::Point, p2::Point, p3::Point, action=:nothing)Add a circular arc centered at c1 that starts at p2 and ends at p3, going counterclockwise, to the current path.
c1-p2 really determines the radius. If p3 doesn't lie on the circular path, it will be used only as an indication of the arc's length, rather than its position.
Luxor.curve — Function.curve(x1, y1, x2, y2, x3, y3)
curve(p1, p2, p3)Add a Bézier curve.
The spline starts at the current position, finishing at x3/y3 (p3), following two control points x1/y1 (p1) and x2/y2 (p2).
Geometry tools
You can find the midpoint between two points using midpoint().
The following code places a small pentagon (using ngon()) at the midpoint of each side of a larger pentagon:
sethue("red")
ngon(O, 100, 5, 0, :stroke)

sethue("darkgreen")
p5 = ngon(O, 100, 5, 0, vertices=true)

for i in eachindex(p5)
    pt1 = p5[mod1(i, 5)]
    pt2 = p5[mod1(i + 1, 5)]
    ngon(midpoint(pt1, pt2), 20, 5, 0, :fill)
end
┌ Warning: The function `cfunction` is now written as a macro `@cfunction`.
│ caller = get_stream_callback at Cairo.jl:145 [inlined]
└ @ Core Cairo.jl:145
A more general function, between(), finds for a value x between 0 and 1 the corresponding point on a line defined by two points. So midpoint(p1, p2) and between(p1, p2, 0.5) should return the same point.
sethue("red")
p1 = Point(-150, 0)
p2 = Point(150, 40)
line(p1, p2)
strokepath()
for i in -0.5:0.1:1.5
    randomhue()
    circle(between(p1, p2, i), 5, :fill)
end
┌ Warning: The function `cfunction` is now written as a macro `@cfunction`.
│ caller = get_stream_callback at Cairo.jl:145 [inlined]
└ @ Core Cairo.jl:145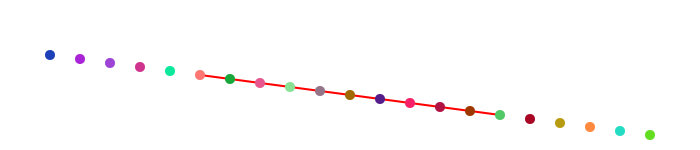
Values less than 0.0 and greater than 1.0 appear to work well too, placing the point on the line if extended.
Luxor.midpoint — Function.midpoint(p1, p2)Find the midpoint between two points.
midpoint(a)Find midpoint between the first two elements of an array of points.
Luxor.between — Function.between(p1::Point, p2::Point, x)
between((p1::Point, p2::Point), x)Find the point between point p1 and point p2 for x, where x is typically between 0 and 1, so these two should be equivalent:
between(p1, p2, 0.5)and
midpoint(p1, p2)center3pts() finds the radius and center point of a circle passing through three points which you can then use with functions such as circle() or arc2r().
intersection() finds the intersection of two lines.
sethue("black")
P1, P2, P3, P4 = ngon(O, 100, 5, vertices=true)
label.(["P1", "P2", "P3", "P4"], :N, [P1, P2, P3, P4])
line(P1, P2, :stroke)
line(P4, P3, :stroke)

flag, ip =  intersection(P1, P2, P4, P3)
if flag
    circle(ip, 5, :fill)
end
┌ Warning: The function `cfunction` is now written as a macro `@cfunction`.
│ caller = get_stream_callback at Cairo.jl:145 [inlined]
└ @ Core Cairo.jl:145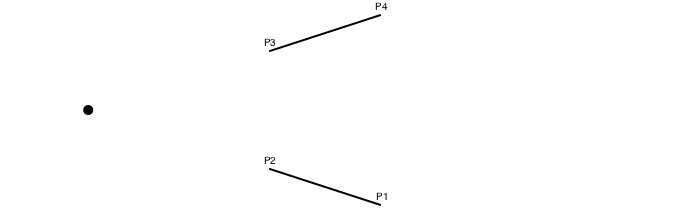
Notice that the order in which the points define the lines is important (P1 to P2, P4 to P3). The collinearintersect=true option may also help.
intersectionlinecircle() finds the intersection of a line and a circle. There can be 0, 1, or 2 intersection points.
l1 = Point(-100.0, -75.0)
l2 = Point(300.0, 100.0)
rad = 100
cpoint = Point(0, 0)
line(l1, l2, :stroke)
circle(cpoint, rad, :stroke)
nints, ip1, ip2 =  intersectionlinecircle(l1, l2, cpoint, rad)
sethue("black")
if nints == 2
    circle(ip1, 8, :stroke)
    circle(ip2, 8, :stroke)
end
┌ Warning: The function `cfunction` is now written as a macro `@cfunction`.
│ caller = get_stream_callback at Cairo.jl:145 [inlined]
└ @ Core Cairo.jl:145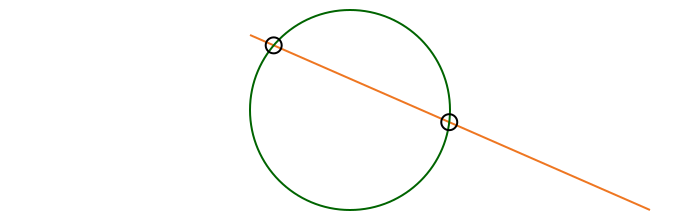
intersection2circles() finds the area of the intersection of two circles, and intersectioncirclecircle() finds the points where they cross.
This example shows the areas of two circles, and the area of their intersection.
c1 = (O, 150)
c2 = (O + (100, 0), 150)

circle(c1... , :stroke)
circle(c2... , :stroke)

sethue("purple")
circle(c1... , :clip)
circle(c2... , :fill)
clipreset()

sethue("black")

text(string(150^2 * pi |> round), c1[1] - (125, 0))
text(string(150^2 * pi |> round), c2[1] + (100, 0))
sethue("white")
text(string(intersection2circles(c1..., c2...) |> round),
     midpoint(c1[1], c2[1]), halign=:center)

sethue("red")
flag, C, D = intersectioncirclecircle(c1..., c2...)
if flag
    circle.([C, D], 5, :fill)
end
┌ Warning: The function `cfunction` is now written as a macro `@cfunction`.
│ caller = get_stream_callback at Cairo.jl:145 [inlined]
└ @ Core Cairo.jl:145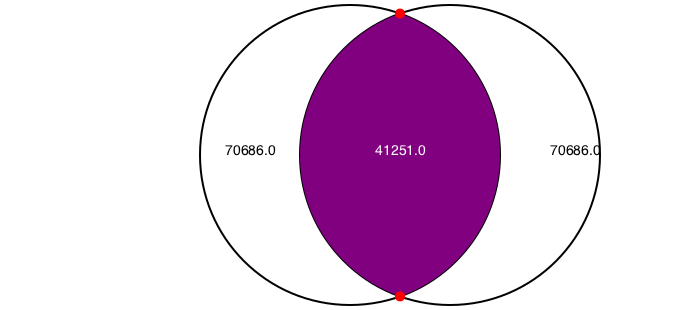
Luxor.intersection — Function.intersection(p1::Point, p2::Point, p3::Point, p4::Point;
commonendpoints = false,
crossingonly = false,
collinearintersect = false)Find intersection of two lines p1-p2 and p3-p4
This returns a tuple: (boolean, point(x, y)).
Keyword options and default values:
crossingonly = falseIf crossingonly = true, lines must actually cross. The function returns (false, intersectionpoint) if the lines don't actually cross, but would eventually intersect at intersectionpoint if continued beyond their current endpoints.
If false, the function returns (true, Point(x, y)) if the lines intersect somewhere eventually at intersectionpoint.
commonendpoints = falseIf commonendpoints= true, will return (false, Point(0, 0)) if the lines share a common end point (because that's not so much an intersection, more a meeting).
Function returns (false, Point(0, 0)) if the lines are undefined.
If you want collinear points to be considered to intersect, set collinearintersect to true, although it defaults to false.
Luxor.intersectionlinecircle — Function.intersectionlinecircle(p1::Point, p2::Point, cpoint::Point, r)Find the intersection points of a line (extended through points p1 and p2) and a circle.
Return a tuple of (n, pt1, pt2)
where
nis the number of intersections,0,1, or2pt1is first intersection point, orPoint(0, 0)if nonept2is the second intersection point, orPoint(0, 0)if none
The calculated intersection points won't necessarily lie on the line segment between p1 and p2.
Luxor.intersection2circles — Function.intersection2circles(pt1, r1, pt2, r2)Find the area of intersection between two circles, the first centered at pt1 with radius r1, the second centered at pt2 with radius r2.
Luxor.intersectioncirclecircle — Function.intersectioncirclecircle(cp1, r1, cp2, r2)Find the two points where two circles intersect, if they do. The first circle is centered at cp1 with radius r1, and the second is centered at cp1 with radius r1.
Returns
(flag, ip1, ip2)where flag is a Boolean true if the circles intersect at the points ip1 and ip2. If the circles don't intersect at all, or one is completely inside the other, flag is false and the points are both Point(0, 0).
Use intersection2circles() to find the area of two overlapping circles.
In the pure world of maths, it must be possible that two circles 'kissing' only have a single intersection point. At present, this unromantic function reports that two kissing circles have no intersection points.
Luxor.boundingboxesintersect — Function.boundingboxesintersect(bbox1::BoundingBox, bbox2::BoundingBox)Return true if the two bounding boxes intersect.
Luxor.ispointonline — Function.ispointonline(pt::Point, pt1::Point, pt2::Point;
extended = false,
atol = 10E-5)Return true if the point pt lies on a straight line between pt1 and pt2.
If extended is false (the default) the point must lie on the line segment between pt1 and pt2. If extended is true, the point lies on the line if extended in either direction.
getnearestpointonline() finds perpendiculars.
end1, end2, pt3 = ngon(O, 100, 3, vertices=true)
map(pt -> circle(pt, 5, :fill), [end1, end2, pt3])
line(end1, end2, :stroke)
arrow(pt3, getnearestpointonline(end1, end2, pt3))
┌ Warning: The function `cfunction` is now written as a macro `@cfunction`.
│ caller = get_stream_callback at Cairo.jl:145 [inlined]
└ @ Core Cairo.jl:145
Luxor.distance — Function.distance(p1::Point, p2::Point)Find the distance between two points (two argument form).
Luxor.getnearestpointonline — Function.getnearestpointonline(pt1::Point, pt2::Point, startpt::Point)Given a line from pt1 to pt2, and startpt is the start of a perpendicular heading to meet the line, at what point does it hit the line?
Luxor.pointlinedistance — Function.pointlinedistance(p::Point, a::Point, b::Point)Find the distance between a point p and a line between two points a and b.
Luxor.slope — Function.slope(pointA::Point, pointB::Point)Find angle of a line starting at pointA and ending at pointB.
Return a value between 0 and 2pi. Value will be relative to the current axes.
slope(O, Point(0, 100)) |> rad2deg # y is positive down the page
90.0

slope(Point(0, 100), O) |> rad2deg
270.0Luxor.perpendicular — Function.perpendicular(p1, p2, k)Return a point p3 that is k units away from p1, such that a line p1 p3 is perpendicular to p1 p2.
Convention? to the right?
perpendicular(p::Point)Returns point Point(p.y, -p.x).
Luxor.dotproduct — Function.dotproduct(a::Point, b::Point)Return the scalar dot product of the two points.
Luxor.@polar — Macro.@polar (p)Convert a tuple of two numbers to a Point of x, y Cartesian coordinates.
@polar (10, pi/4)
@polar [10, pi/4]
produces
Luxor.Point(7.0710678118654755,7.071067811865475)Luxor.polar — Function.polar(r, theta)Convert point in polar form (radius and angle) to a Point.
polar(10, pi/4)produces
Luxor.Point(7.071067811865475,7.0710678118654755)Arrows
You can draw lines or arcs with arrows at the end with arrow(). For straight arrows, supply the start and end points. For arrows as circular arcs, you provide center, radius, and start and finish angles. You can optionally provide dimensions for the arrowheadlength and arrowheadangle of the tip of the arrow (angle in radians between side and center). The default line weight is 1.0, equivalent to setline(1)), but you can specify another.
arrow(O, Point(0, -65))
arrow(O, Point(100, -65), arrowheadlength=20, arrowheadangle=pi/4, linewidth=.3)
arrow(O, 100, pi, pi/2, arrowheadlength=25,   arrowheadangle=pi/12, linewidth=1.25)
┌ Warning: The function `cfunction` is now written as a macro `@cfunction`.
│ caller = get_stream_callback at Cairo.jl:145 [inlined]
└ @ Core Cairo.jl:145![]()
Luxor.arrow — Function.arrow(startpoint::Point, endpoint::Point;
linewidth = 1.0,
arrowheadlength = 10,
arrowheadangle = pi/8)Draw a line between two points and add an arrowhead at the end. The arrowhead length will be the length of the side of the arrow's head, and the arrowhead angle is the angle between the sloping side of the arrowhead and the arrow's shaft.
Arrows don't use the current linewidth setting (setline()), and defaults to 1, but you can specify another value. It doesn't need stroking/filling, the shaft is stroked and the head filled with the current color.
arrow(centerpos::Point, radius, startangle, endangle;
    linewidth = 1.0,
    arrowheadlength = 10,
    arrowheadangle = pi/8)
Draw a curved arrow, an arc centered at centerpos starting at startangle and ending at endangle with an arrowhead at the end. Angles are measured clockwise from the positive x-axis.
Arrows don't use the current linewidth setting (setline()); you can specify the linewidth.
Julia graphics
A couple of functions in Luxor provide you with instant access to the Julia logo, and the three colored circles:
for (pos, n) in Tiler(750, 250, 1, 2)
    gsave()
    translate(pos - Point(150, 100))
    if n == 1
        julialogo()
    elseif n == 2
        julialogo(action=:clip)
        for i in 1:500
            gsave()
            translate(rand(0:400), rand(0:250))
            juliacircles(10)
            grestore()
        end
        clipreset()
    end
    grestore()
end
┌ Warning: The function `cfunction` is now written as a macro `@cfunction`.
│ caller = get_stream_callback at Cairo.jl:145 [inlined]
└ @ Core Cairo.jl:145![]()
Luxor.julialogo — Function.julialogo(;action=:fill, color=true)Draw the Julia logo. The default action is to fill the logo and use the colors:
julialogo()If color is false, the logo will use the current color, and the dots won't be colored in the usual way.
The logo's dimensions are about 330 wide and 240 high, and the 0/0 point is at the bottom left corner. To place the logo by locating its center, do this:
gsave()
translate(-165, -120)
julialogo() # locate center at 0/0
grestore()
To use the logo as a clipping mask:
julialogo(action=:clip)(In this case the color setting is automatically ignored.)
Luxor.juliacircles — Function.juliacircles(radius=100)Draw the three Julia circles in color centered at the origin.
The distance of the centers of the circles from the origin is radius. The optional keyword arguments outercircleratio (default 0.75) and innercircleratio (default 0.65) control the radius of the individual colored circles relative to the radius. So you can get relatively smaller or larger circles by adjusting the ratios.
Bounding boxes
The BoundingBox type allows you to use rectangular extents to organize and interact with the 2D drawing area. A BoundingBox instance returns two points, the opposite corners of a bounding box.
BoundingBox() without arguments defines an extent that encloses the drawing (assuming that the origin is at the center of the drawing—see origin()).
This example draws circles at three points: at two of the drawing's corners and the midway point between them:
origin()

bb = BoundingBox()
setline(10)
sethue("orange")

circle(bb[1], 150, :stroke) # first corner

circle(bb[2], 150, :stroke) # second corner

circle(midpoint(bb...), 150, :stroke) # midpoint

sethue("blue")
circle.([bb[1], midpoint(bb[1:2]), bb[2]], 130, :fill)

sethue("red")
circle.([first(bb), midpoint(bb...), last(bb)], 100, :fill)
┌ Warning: The function `cfunction` is now written as a macro `@cfunction`.
│ caller = get_stream_callback at Cairo.jl:145 [inlined]
└ @ Core Cairo.jl:145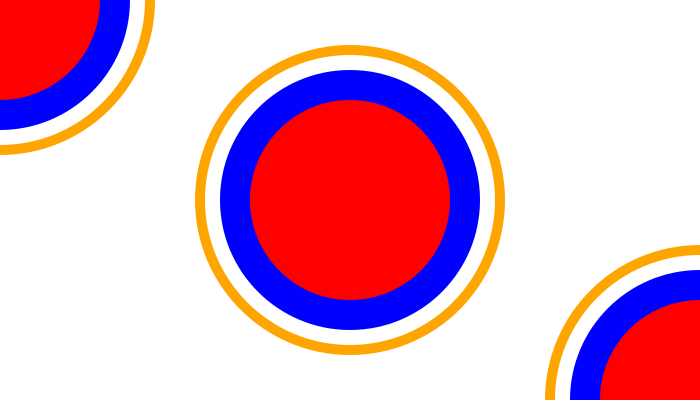
You can make a BoundingBox from two points, a text string, an existing polygon, or by modifying an existing one.
p = star(O, 100, 5, 0.1, pi/3.3, vertices=true)
sethue("antiquewhite")
box(BoundingBox(p), :fill)

sethue("black")
poly(p, :stroke, close=true)
┌ Warning: The function `cfunction` is now written as a macro `@cfunction`.
│ caller = get_stream_callback at Cairo.jl:145 [inlined]
└ @ Core Cairo.jl:145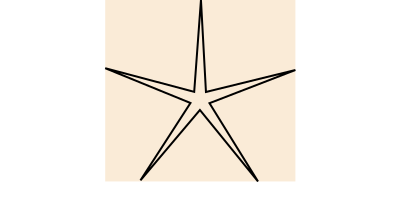
The bounding box objects can be passed to box() or poly() to be drawn.
You can also do some arithmetic on bounding boxes. In the next example, the text's bounding box is filled with yellow, increased by 20 units (blue), scaled by 1.3 (green), and shifted by (0, 100) (orange).
translate(-130,0)
fontsize(40)
str = "good afternoon"
sethue("yellow")
box(BoundingBox(str), :fill)
sethue("black")
text(str)

sethue("blue")
modbox = BoundingBox(str) + 40 # add 20 units to all sides
poly(modbox, :stroke, close=true)

sethue("green")
modbox = BoundingBox(str) * 1.3
poly(modbox, :stroke, close=true)

sethue("orange")
modbox = BoundingBox(str) + (0, 100)
poly(modbox, :fill, close=true)
┌ Warning: The function `cfunction` is now written as a macro `@cfunction`.
│ caller = get_stream_callback at Cairo.jl:145 [inlined]
└ @ Core Cairo.jl:145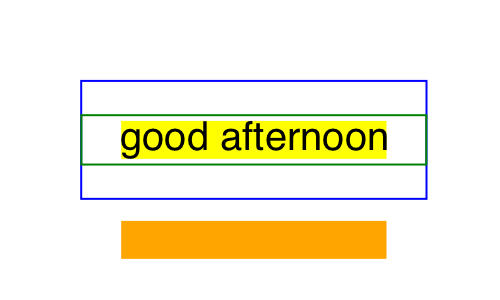
You can find the union and intersection of BoundingBoxes, and also find whether a point lies inside one. The following code creates, shrinks, and shifts two bounding boxes (colored yellow and pink), and then draws: their union (a bounding box that includes both), in black outline; and their intersection (a bounding box of their common areas), in red. Then some random points are created and drawn differently depending on whether they're inside the intersection or outside.
origin()
setopacity(0.75)
setline(8)

bbox1 = BoundingBox()/2 - (50, 30)
sethue("yellow")
box(bbox1, :fill)

bbox2 = BoundingBox()/2  + (50, 30)
sethue("pink")
box(bbox2, :fill)

sethue("black")
box(bbox1 + bbox2, :stroke)

sethue("red")
bothboxes = intersectboundingboxes(bbox1, bbox2)
box(bothboxes, :fill)

for i in 1:500
    pt = randompoint(bbox1 + bbox2...)
    if isinside(pt, bothboxes)
        sethue("white")
        circle(pt, 3, :fill)
    else
        sethue("black")
        circle(pt, 2, :fill)
    end
end
┌ Warning: The function `cfunction` is now written as a macro `@cfunction`.
│ caller = get_stream_callback at Cairo.jl:145 [inlined]
└ @ Core Cairo.jl:145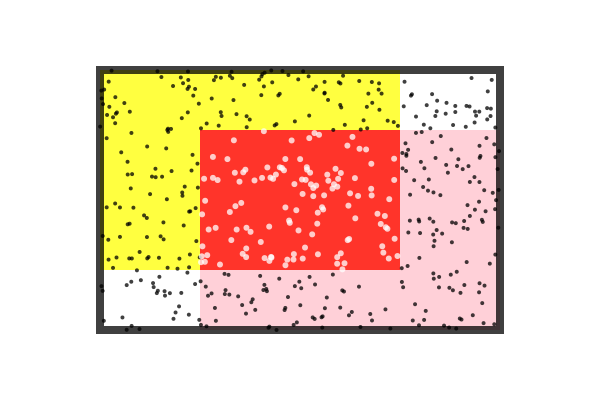
Luxor.BoundingBox — Type.The BoundingBox type holds two Points, corner1 and corner2.
BoundingBox(;centered=true) # the bounding box of the Drawing
BoundingBox(s::String)      # the bounding box of a text string
BoundingBox(pt::Array) # the bounding box of a polygonLuxor.boxaspectratio — Function.boxaspectratio(bb::BoundingBox)Return the aspect ratio (the height divided by the width) of bounding box bb.
Luxor.boxdiagonal — Function.boxdiagonal(bb::BoundingBox)Return the length of the diagonal of bounding box bb.
Luxor.boxwidth — Function.boxwidth(bb::BoundingBox)Return the width of bounding box bb.
Luxor.boxheight — Function.boxheight(bb::BoundingBox)Return the height of bounding box bb.
Luxor.intersectboundingboxes — Function.intersectionboundingboxes(bb1::BoundingBox, bb2::BoundingBox)Returns a bounding box intersection.
Luxor.boxtop — Function.boxtop(bb::BoundingBox)Return the top center point of bounding box bb.
Luxor.boxbottom — Function.boxbottom(bb::BoundingBox)Return the top center point of bounding box bb.
Miscellaneous
Hypotrochoids
hypotrochoid() makes hypotrochoids. The result is a polygon. You can either draw it directly, or pass it on for further polygon fun, as here, which uses offsetpoly() to trace round it a few times.
origin()
background("grey15")
sethue("antiquewhite")
setline(1)
p = hypotrochoid(100, 25, 55, :stroke, stepby=0.01, vertices=true)
for i in 0:3:15
    poly(offsetpoly(p, i), :stroke, close=true)
end
┌ Warning: The function `cfunction` is now written as a macro `@cfunction`.
│ caller = get_stream_callback at Cairo.jl:145 [inlined]
└ @ Core Cairo.jl:145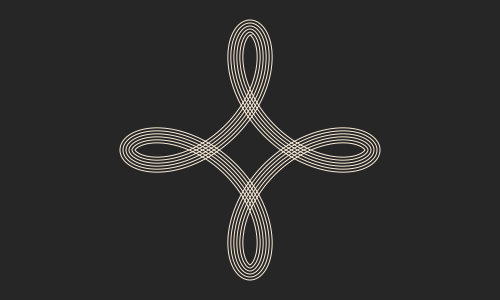
There's a matching epitrochoid() function.
Luxor.hypotrochoid — Function.hypotrochoid(R, r, d, action=:none;
stepby=0.01,
period=0,
vertices=false)Make a hypotrochoid with short line segments. (Like a Spirograph.) The curve is traced by a point attached to a circle of radius r rolling around the inside of a fixed circle of radius R, where the point is a distance d from the center of the interior circle. Things get interesting if you supply non-integral values.
Special cases include the hypocycloid, if d = r, and an ellipse, if R = 2r.
stepby, the angular step value, controls the amount of detail, ie the smoothness of the polygon,
If period is not supplied, or 0, the lowest period is calculated for you.
The function can return a polygon (a list of points), or draw the points directly using the supplied action. If the points are drawn, the function returns a tuple showing how many points were drawn and what the period was (as a multiple of pi).
Luxor.epitrochoid — Function.epitrochoid(R, r, d, action=:none;
stepby=0.01,
period=0,
vertices=false)Make a epitrochoid with short line segments. (Like a Spirograph.) The curve is traced by a point attached to a circle of radius r rolling around the outside of a fixed circle of radius R, where the point is a distance d from the center of the circle. Things get interesting if you supply non-integral values.
stepby, the angular step value, controls the amount of detail, ie the smoothness of the polygon.
If period is not supplied, or 0, the lowest period is calculated for you.
The function can return a polygon (a list of points), or draw the points directly using the supplied action. If the points are drawn, the function returns a tuple showing how many points were drawn and what the period was (as a multiple of pi).
Cropmarks
If you want cropmarks (aka trim marks), use the cropmarks() function, supplying the centerpoint, followed by the width and height:
cropmarks(O, 1200, 1600)
cropmarks(O, paper_sizes["A0"]...)
sethue("red")
box(O, 150, 150, :stroke)
cropmarks(O, 150, 150)┌ Warning: The function `cfunction` is now written as a macro `@cfunction`.
│ caller = get_stream_callback at Cairo.jl:145 [inlined]
└ @ Core Cairo.jl:145
Luxor.cropmarks — Function.cropmarks(center, width, height)Draw cropmarks (also known as trim marks).
Bars
For simple bars, use the bars() function, supplying an array of numbers:
fontsize(7)
sethue("black")
v = rand(-100:100, 25)
bars(v)
┌ Warning: The function `cfunction` is now written as a macro `@cfunction`.
│ caller = get_stream_callback at Cairo.jl:145 [inlined]
└ @ Core Cairo.jl:145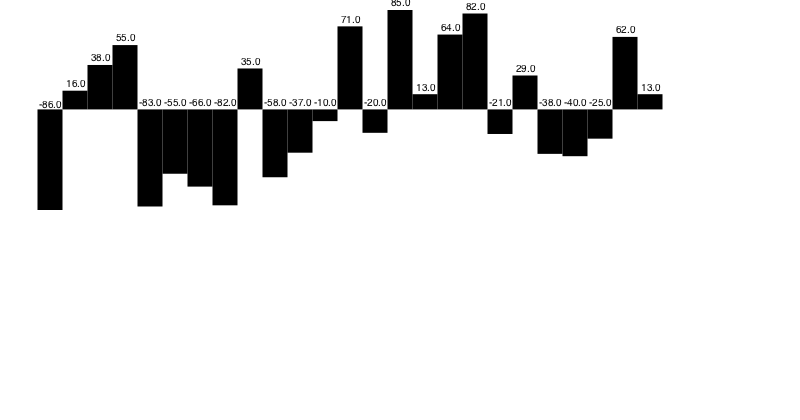
To change the way the bars and labels are drawn, define some functions and pass them as keyword arguments to bars():
function mybarfunction(low::Point, high::Point, value;
    extremes=[0, 1], barnumber=0, bartotal=0)
    @layer begin
        sethue(Colors.HSB(rescale(value, extremes[1], extremes[2], 0, 360), 1.0, 0.5))
        csize = rescale(value, extremes[1], extremes[2], 5, 25)
        circle(high, csize, :fill)
        setline(1)
        sethue("blue")
        line(Point(low.x, 0), high + (0, csize), :stroke)
        sethue("white")
        text(string(value), high, halign=:center, valign=:middle)
    end
end

function mylabelfunction(low::Point, high::Point, value;
    extremes=[0, 1], barnumber=0, bartotal=0)
    @layer begin
        translate(low)
        text(string(value), O + (0, 10), halign=:center, valign=:middle)
    end
end

v = rand(1:100, 25)
bars(v, xwidth=25, barfunction=mybarfunction, labelfunction=mylabelfunction)
┌ Warning: The function `cfunction` is now written as a macro `@cfunction`.
│ caller = get_stream_callback at Cairo.jl:145 [inlined]
└ @ Core Cairo.jl:145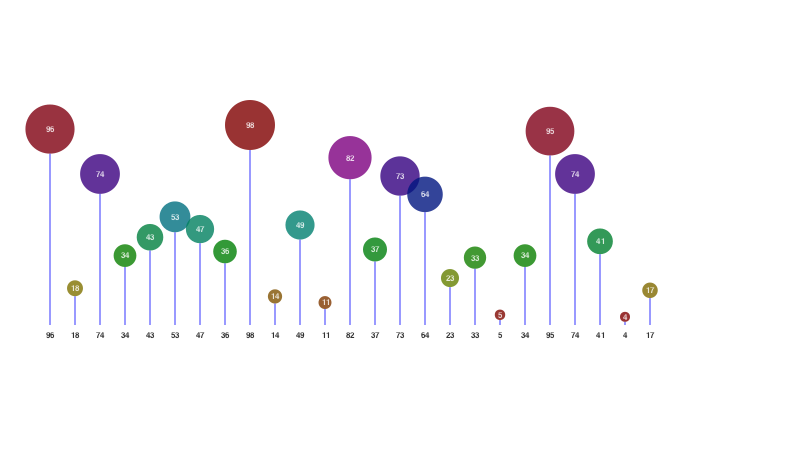
Luxor.bars — Function.bars(values::AbstractArray;
yheight = 200,
xwidth = 25,
labels = true,
barfunction = f,
labelfunction = f,
)Draw some bars where each bar is the height of a value in the array. The bars will fit in a box yheight high (even if there are negative values).
To control the drawing of the text and bars, define functions that process the end points:
mybarfunction(bottom::Point, top::Point, value; extremes=[a, b], barnumber=0, bartotal=0)
mylabelfunction(bottom::Point, top::Point, value; extremes=[a, b], barnumber=0, bartotal=0)
and pass them like this:
bars(v, yheight=10, xwidth=10, barfunction=mybarfunction)
bars(v, xwidth=15, yheight=10, labelfunction=mylabelfunction)
To suppress the text labels, use optional keyword labels=false.